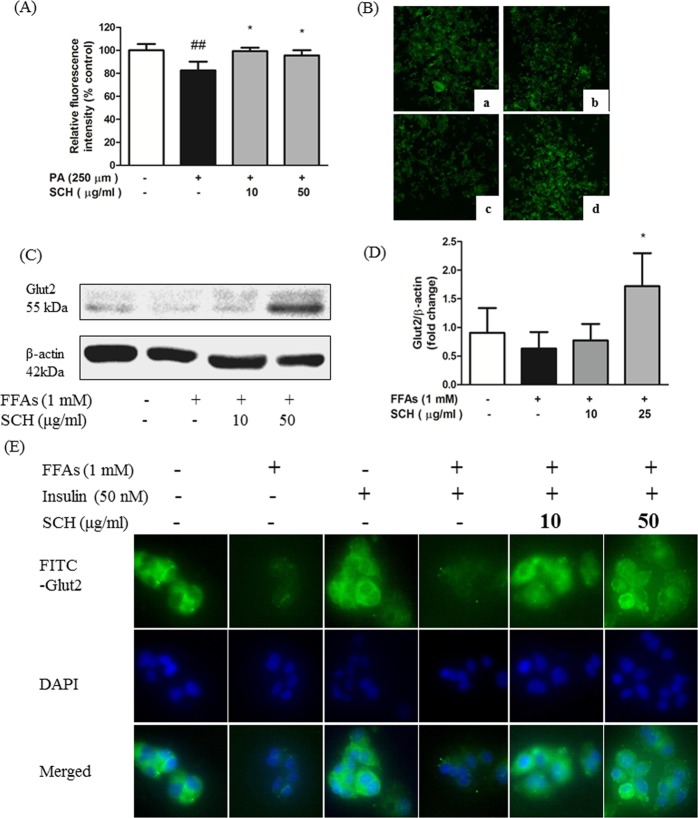
Figure 5.
Impacts of SCH on glucose uptake and GLUT2 protein in FFA-induced steatotic HepG2 cells. (A) Relative fluorescence intensity (2-NBDG) of HepG2 cells implying glucose uptake rate. (B) Representative fluorescence images of steatotic HepG2 showing relative glucose uptake rate. Cells were untreated (a), FFA-treated (b), exposed to FFA with 10 μg/ml of SCH (c), exposed to 50 μg/ml of SCH (d). (C) Representative blot of GLUT2 protein is depicted. (D) Band intensity was measured with densitometric analysis and normalized to the intensity of β-actin. (E) Immunofluorescence images showing the impact of SCH on localization of Glut 2 protein in insulin-stimulated FFA-induced HepG2 cells. Images were taken at magnification of 400×. Data are expressed as mean ± SD.

