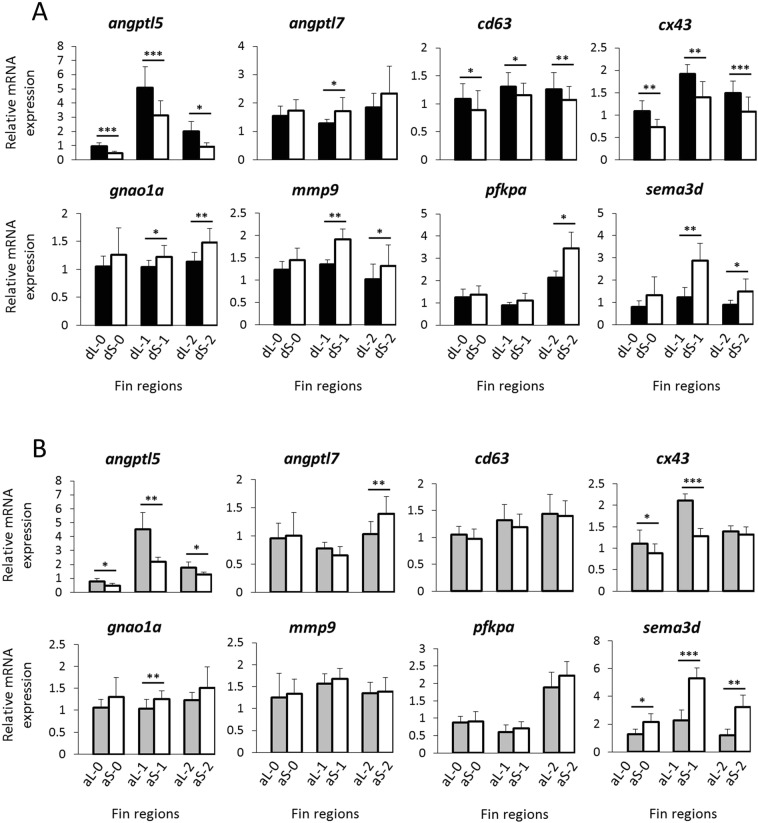
Figure 3.
Expression levels of members of a gene regulatory network involved in fin formation/regeneration in the elongated and short fin regions. (A) Dorsal fin, (B) anal fin. Only genes with significant L/S expression in at least on fin type are included. Means and standard deviations of RQ values in six biological replicates are shown for the elongated (L) and short (S) fin regions; numbers 0 to 2 identify regeneration stages. See Fig. 1A for fin region codes. Significant differences between L and S regions are indicated by asterisks (*P < 0.05; **P < 0.01; ***P < 0.001).

