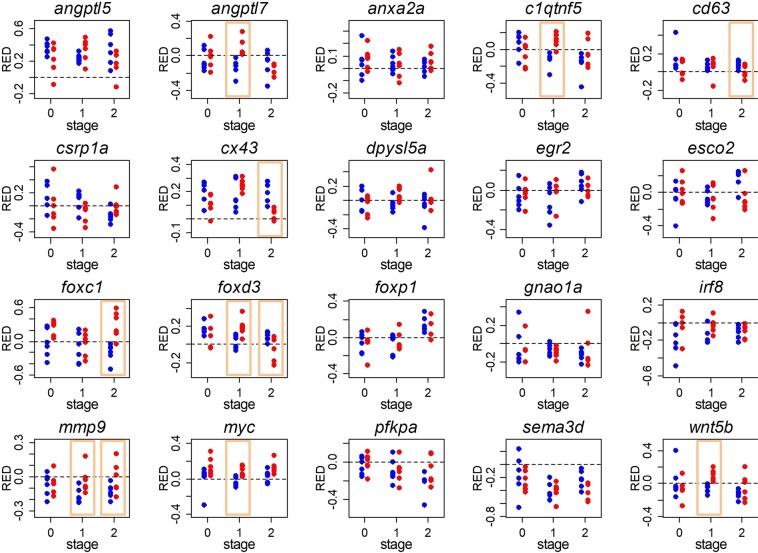
Figure 5.
Comparisons of L/S expression patterns between fins. For each of the tested genes, relative expression differences between L and S tissue (RED values) are shown at each regeneration stage and for each fin type (blue dots: dorsal fin; red dots: anal fin). Each dot represents one biological replicate. RED > 0 indicates higher expression in L than in S tissue (L > S expression), while RED < 0 indicates L < S expression. Yellow squares highlight significant differences in RED values between dorsal and anal fins (Mann-Whitney U-test, p < 0.05).

