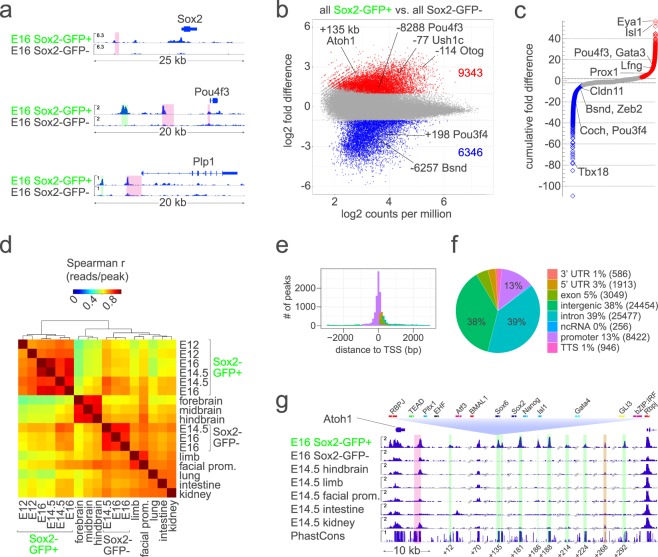
Figure 2.
ATAC-seq detects gene regulatory features that include known otic enhancers in Sox2-EGFPhigh+ cells of the embryonic cochlear duct. (a) Shows ATAC-seq signal in E16 Sox2-EGFPhigh+ cochlear cells relative to that in E16 Sox2-EGFP− cochlear cells collected in parallel at the Sox2, Pou4f3, and Plp1 loci. Highlighted in pink are known enhancer regions. Highlighted in green are novel open chromatin regions detected only in Sox2-EGFPhigh+ cells of the embryonic cochlear duct. (b) Shows fold difference relative to the normalized read counts for ATAC-seq peaks determined to be significantly increased (red), significantly decreased (blue) or unchanged (grey) in Sox2-EGFPhigh+ cells from E12-16 cochlear duct versus Sox2-EGFP− cells from E14.5-16 cochlear duct. (c) Shows the cumulative fold differences (i.e. the sum of the fold differences of all peaks nearest to each gene) in accessibility of each gene in Sox2-EGFPhigh+ cells from E12-16 cochlear duct versus Sox2-EGFP− cells from E14.5-16 cochlear duct. In the highlighted genes, accessibility corresponds to known differential patterns of gene expression. (d) shows a clustered Spearman correlation matrix of the reads in peaks from ATAC-seq of FACS-sorted cochlear cells and of various E14.5 tissues. Note that reads in cochlear ATAC-seq samples are highly correlated. (e) Shows the frequency of ATAC-seq peaks relative to the distance to transcription start sites. (f) Shows the percentages of all replicated peaks detected in Sox2-EGFPhigh+ cells of the E12-16 cochlear duct mapping to the indicated genomic features. (g) Shows ATAC-seq signal at the Atoh1 locus in E16 Sox2-EGFPhigh+ cochlear cells aligned to that in E16 Sox2-EGFP− cochlear cells collected in parallel; several other E14.5 tissues, and PhastCons 30-way vertebrate conservation. As an example of transcription factor binding motifs in peaks, we show those predicted in the +135 kb peak. Highlighted in pink is the known 3′ enhancer. Highlighted in green are 7 open chromatin regions specific to Sox2-EGFPhigh+ cells of the embryonic cochlear duct downstream of Atoh1. Highlighted in gold is a region that increased in accessibility in E14.5 vs. E12 Sox2-EGFPhigh+ cells of the embryonic cochlear duct. Transcription factor families having similar bindings motifs are color-coded. Highest scoring members of each family are indicated.

