Figure 4.
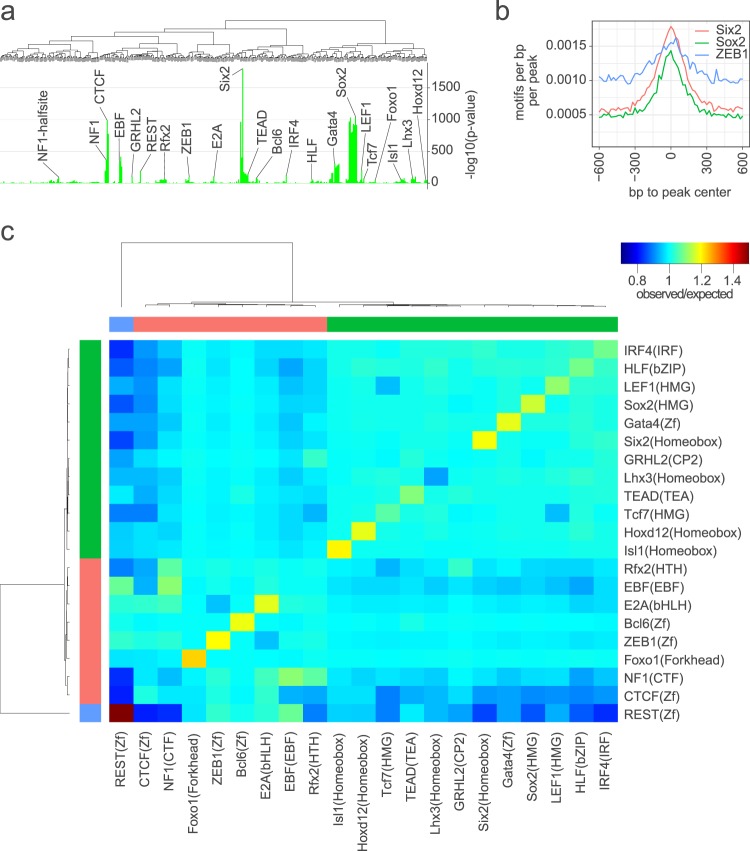
Motif enrichment and co-occurrence in prosensory-specific open chromatin regions of the embryonic cochlear duct. (a) Shows the motif enrichment as -log10 of the p-value in the subset of replicated peaks detected only in Sox2-EGFPhigh+ cells from E12-16 cochlear duct (i.e., not detected in Sox2-EGFP- cells or other ENCODE datasets examined). (b) Plots quantitative differences in enrichment of representative motifs as the frequency of motifs relative to peak center. (c) Plots clustered matrix of the ratio of the observed frequency of co-occurrence of each combination of enriched motifs in the prosensory-specific peaks relative to the expected frequency of co-occurrence.

