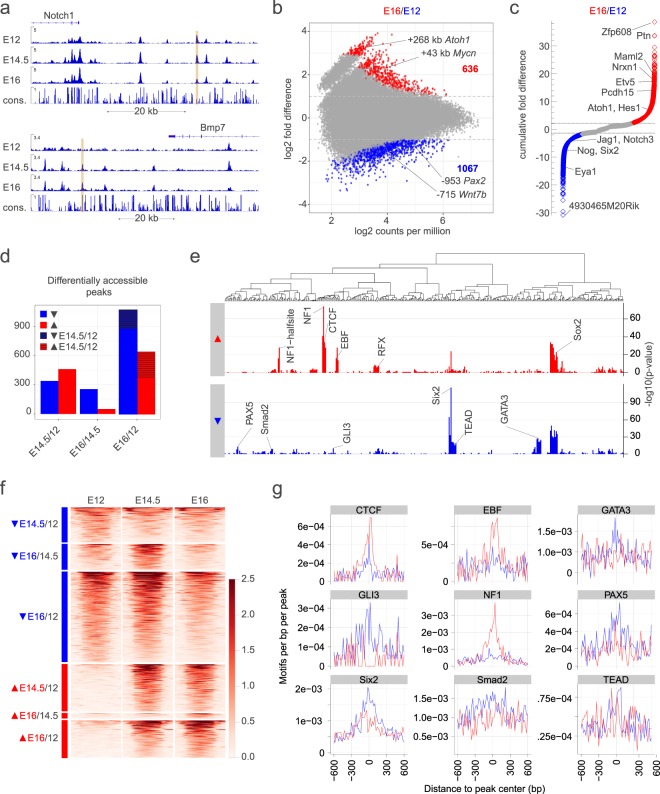
Figure 5.
Developmentally-dynamic open chromatin in Sox2-EGFPhigh+ cells of the embryonic cochlear duct. (a) Shows examples of developmentally dynamic ATAC-seq peaks (gold) in Sox2-EGFPhigh+ cells of the E12-16 cochlear duct at the indicated loci. (b) Shows the fold difference relative to the normalized read counts for ATAC-seq peaks determined to be significantly increased (red), significantly decreased (blue) or unchanged (grey) in Sox2-EGFPhigh+ cells from E16 cochlear duct versus those from E12 cochlear duct. (c) Shows the cumulative fold differences (i.e. the sum of the fold differences of all peaks nearest to each gene) in accessibility of each gene in Sox2-EGFPhigh+ cells from E16 cochlear duct versus those from E12 cochlear duct. (d) Shows the numbers of differentially accessible peaks detected in Sox2-EGFPhigh+ cells at the indicated stages. Note that most significant changes were detected in the E12-14.5 window. (e) Shows differential motif enrichment in peaks increasing in accessibility in E12-16 Sox2-EGFPhigh+ cells from the cochlear duct relative to those decreasing in accessibility. (f) Plots normalized reads in the differentially accessible regions. (g) Plots the frequency of differentially enriched motifs relative to peak center.

