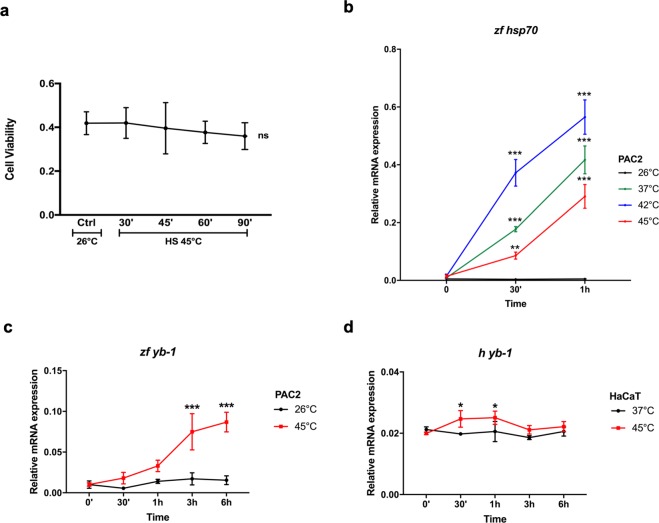
Figure 2.
Heat shock induces yb-1 transcript levels in zebrafish but not in mammalian cells. (a) cell viability of PAC2 cells after heat shock treatment at 45 °C. Cells were subjected to elevated temperatures for the times indicated on the x-axis and cell viability values (MTT) are plotted on the y-axis. Statistical analysis was performed using 1-way ANOVA followed by Dunnett’s multiple comparisons test; ns indicates no statistical significance (see also Table S1); (b–d) RT-qPCR analysis of zebrafish zf hsp70 (b), zf yb-1 (c) in PAC2 cells and human h yb-1 (d) in HaCaT cells. Samples were taken at different time points during and after 1 hour of heat shock treatment at the indicated temperatures (for precise experimental details, see materials and methods section). Mean mRNA relative expression (n = 3) ± SD is plotted on the y-axes, whereas time is plotted on the x-axes. Statistical analysis was performed using 2-way ANOVA and Sidak’s multiple comparison test. Levels of significance between points of expression and time 0 are indicated (***p < 0.001, **p < 0.01, *p < 0.05) (see also Table S1 for statistical analysis).

