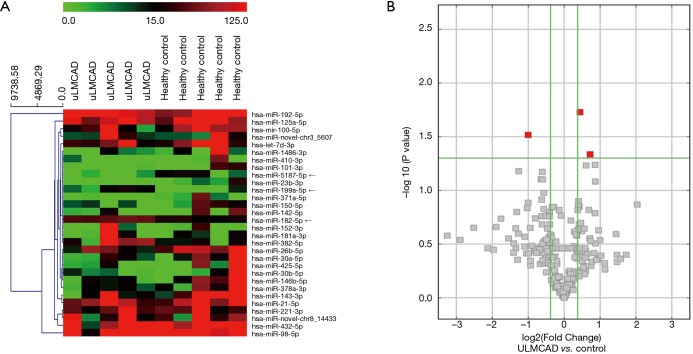
Figure 1.
Overview of miRNAs expression profiling in coronary plasma. (A) Heat map and unsupervised hierarchical clustering analysis of the top 30 miRNAs differential expression level between 5 uLMCAD cases and 5 non-CAD controls; (B) volcano plot of detectable genome-wide miRNA profiles in screening cohorts. The X-axis shows the log2 fold change in miRNAs’ expression levels in uLMCAD patients compared to non-CAD controls, while the Y-axis shows the –log10 of P value. The highlighted red square symbols mark the three miRNAs with the lowest P values found in the plasma from uLMCAD patients compared with the non-CAD controls: miR-182-5p, miR-5187-5p and miR-199a-5p.

