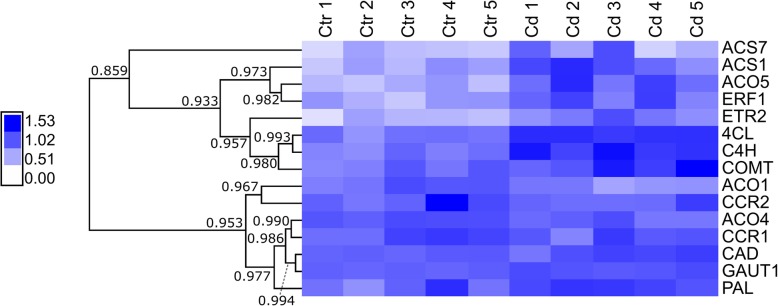
Fig. 3.
Heat map hierarchical clustering showing the expression of genes assessed by qPCR. Values represent relative normalised expression values. The colour bar indicates the expression values as an increasing intensity gradient. Numbers refer to the Pearson correlation coefficient between the lengths of two branches. ACS (1-aminocyclopropane-1-carboxylic acid synthase), ACO (1-aminocyclopropane-1-carboxylic acid oxidase), ERF (ethylene responsive factor), ETR (ethylene-resistant), 4CL (4-coumarate ligase), C4H (cinnamate-4-hydroxylase), COMT (caffeate O-methyltransferase), CCR (cinnamoyl-CoA reductase), CAD (cinnamyl alcohol dehydrogenase), PAL (phenylalanine ammonia lyase)

