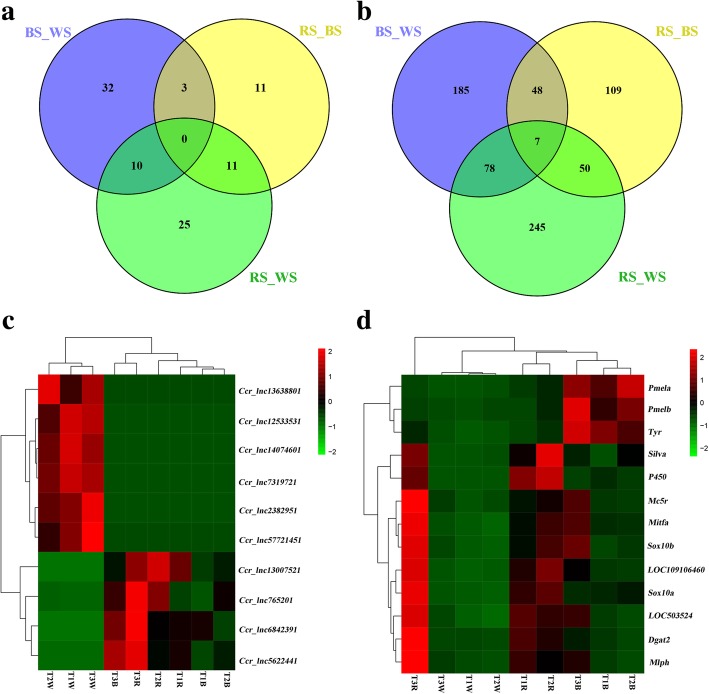
Fig. 3.
a Venn diagram of differentially expressed lncRNAs in the three pairwise comparison groups; b Venn diagram of differentially expressed mRNAs in the three pairwise comparison groups; c Heatmaps and hierarchical clustering of 10 selected lncRNAs. d Heatmaps and hierarchical clustering of 13 randomly selected mRNAs. High to low expression is colored green to red

