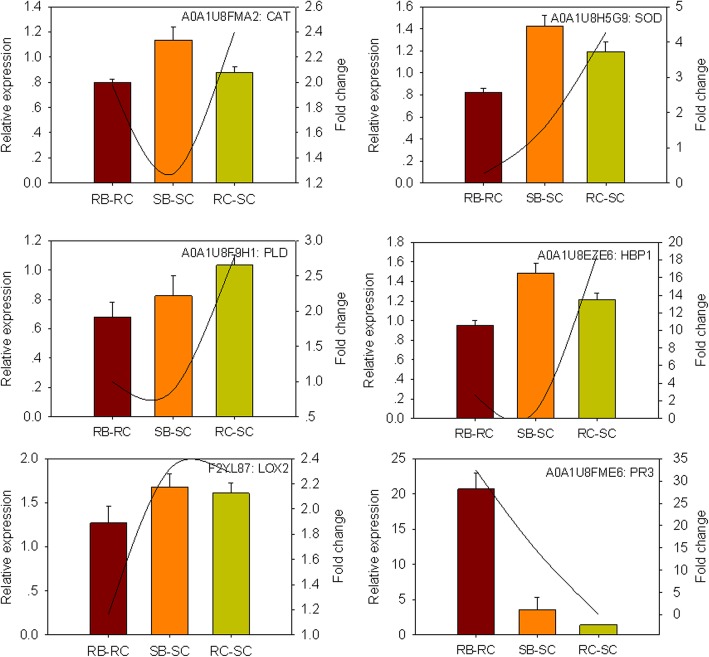
Fig. 7.
Real-time PCR analysis of genes encoding the selected proteins in RB-RC, SB-SC and RC-SC. RB-RC represents protein level changes in the resistant genotype after B. tabaci infestation; SB-SC represents protein level changes in the susceptible genotype after B. tabaci infestation; RC-SC represents protein level changes in the resistant/susceptible genotype under control conditions. The expression levels of CAT, SOD, HBP1, LOX2, PLD and PR3 were quantified relative to the value obtained from control samples (B. tabaci-free plants). The column means the relative expression level of genes and the line means the trend value of iTRAQ

