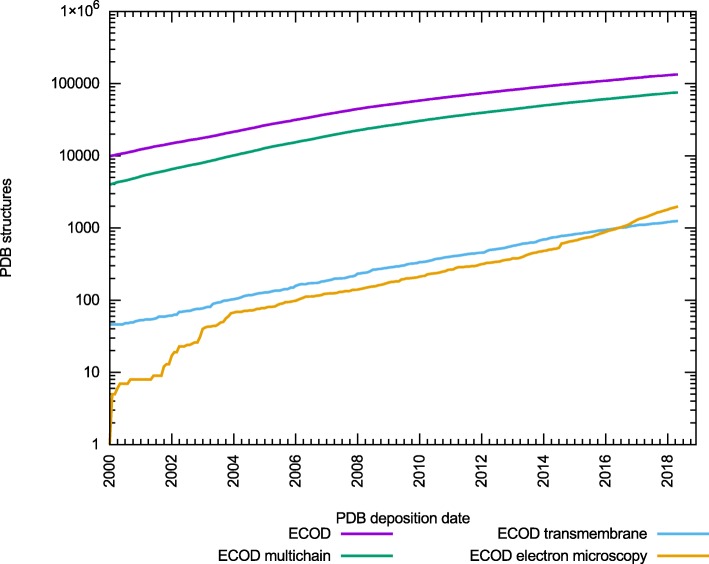
Fig. 1.
Increase of complex structures classified by ECOD. The distribution of protein structures classified by ECOD (red) that are either multi-chain (green), contain at least one transmembrane regions (blue), or are determined by electron microscopy techniques(cyan). The rate of increase of each of these types of structure is similar

