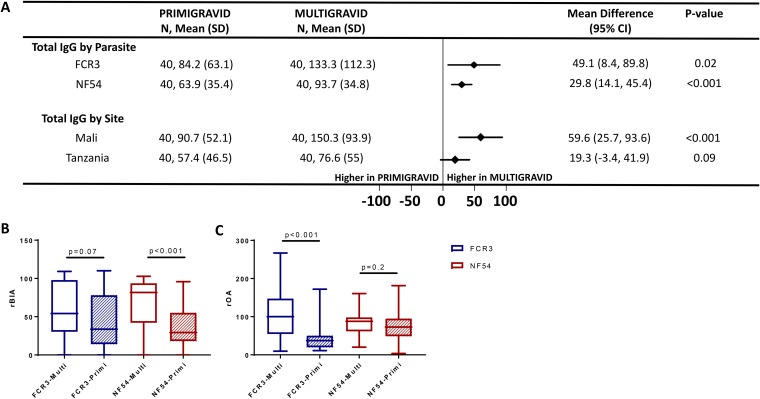
FIG 2.
Reactivity and function of plasma antibodies to CSA-binding parasites by parity. (A) The forest plot shows the mean difference with 95% confidence interval (CI) for total IgG binding to CSA-adhering parasites by parity, and data represent the relative median fluorescence intensity. N, number of samples in each group; SD, standard deviation. rBIA (B) and rOA (C) against FCR3 and NF54-CSA between primigravidae (hatched box) and multigravidae (open box) are shown. Horizontal lines indicate medians, boxes indicate interquartile ranges, and error bars indicate ranges. A Mann-Whitney test was performed for significance, and P values are reported.

