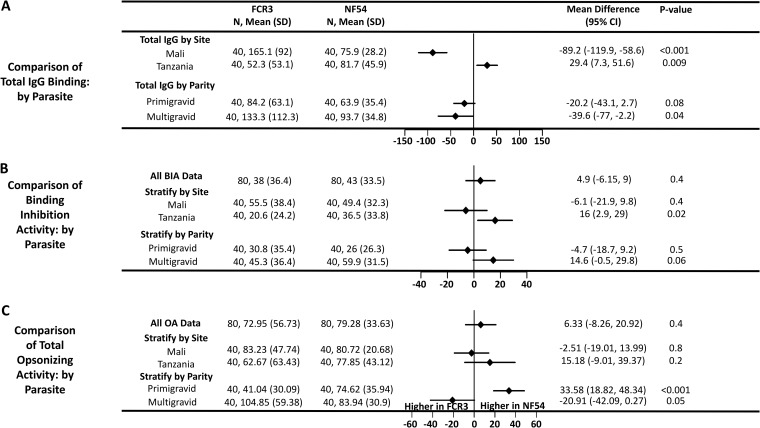
FIG 3.
Reactivity and function of plasma antibodies from pregnant women by parasite variant and stratified by site and parity. The forest plot shows mean differences with 95% confidence intervals (CI) for relative MFI of total IgG binding to CSA-adhering parasites (A), rBIA (B), and rOA (C) against FCR3 and NF54 isolates. N, number of samples.

