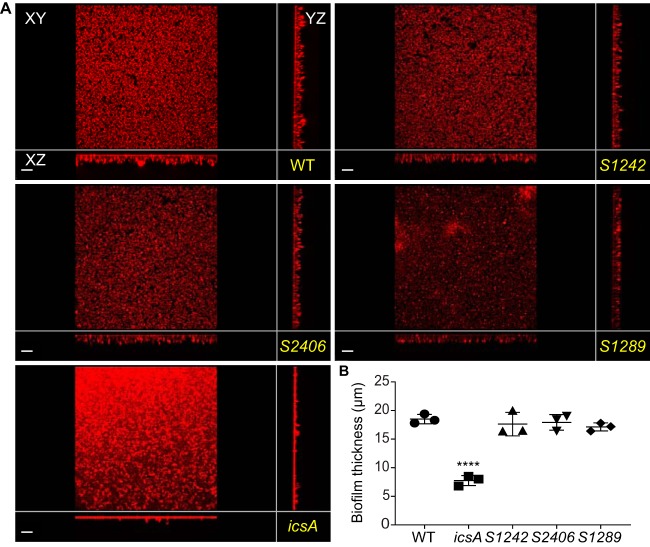
FIG 1.
Phenotypic comparison of the biofilms formed by WT and mutant strains. (A) xy, yz, and xz views of the biofilms formed by the WT and mutant strains. Bars, 20 μm. (B) Quantification of biofilm thickness. Symbols in the graph represent the average biofilm thicknesses in 25 fields of view for each biological replicate. One-way ANOVA with Tukey’s multiple-comparison test was applied for statistical analysis using GraphPad Prism 7.02. ****, P value of <0.0001. Error bars represent standard errors of the means from three biological replicates.

