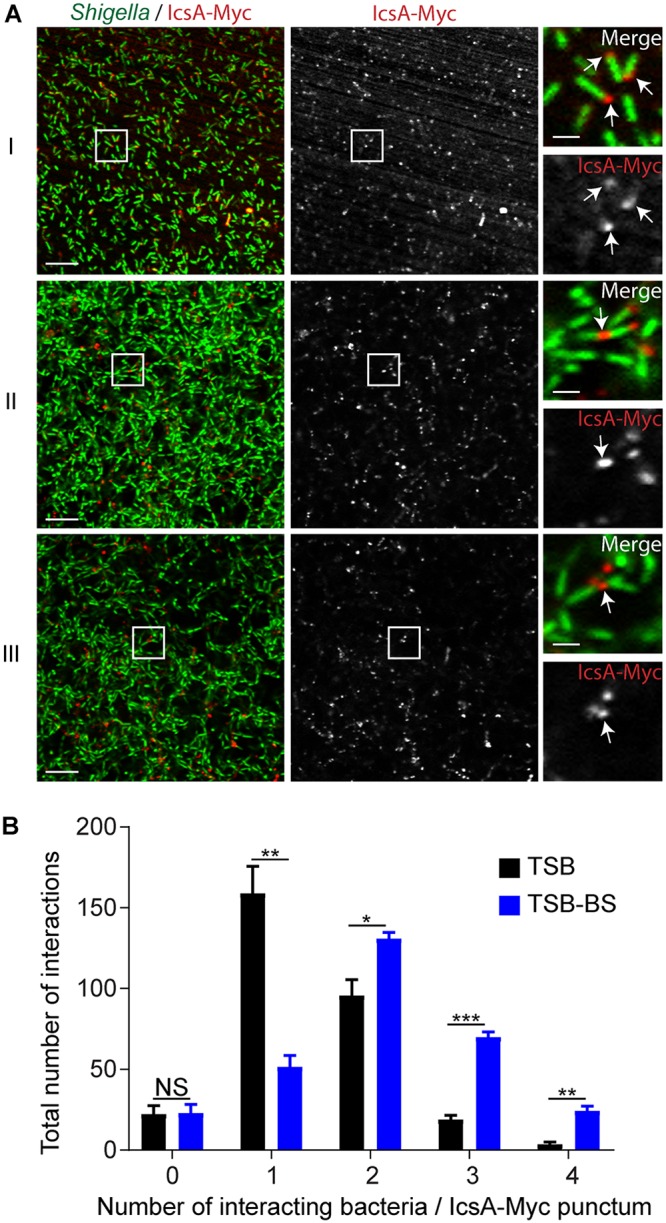
FIG 3.

Characterization of IcsA-Myc localization in biofilms. (A) Right panels (bars, 2 μm) showing high-magnification images of S. flexneri (green) and IcsA-Myc (red) corresponding to the framed area (white squares) in the representative images of biofilms shown in the left and middle panels (bars, 10 μm). (I) IcsA-Myc polar localization in TSB (white arrows); (II and III) IcsA-Myc localization inside representative TSB-BS biofilms showing polar IcsA-Myc-mediated interactions (white arrows) of two (II) or multiple (III) bacterial cells. (B) Quantification of the number of bacterial cells interacting with IcsA-Myc punctae. Two-way ANOVA was applied for statistical analysis using GraphPad Prism 7.02. NS, not significant; *, P value of <0.05; **, P value of <0.01; ***, P value of <0.001. Error bars represent standard errors of the means from three biological replicates.
