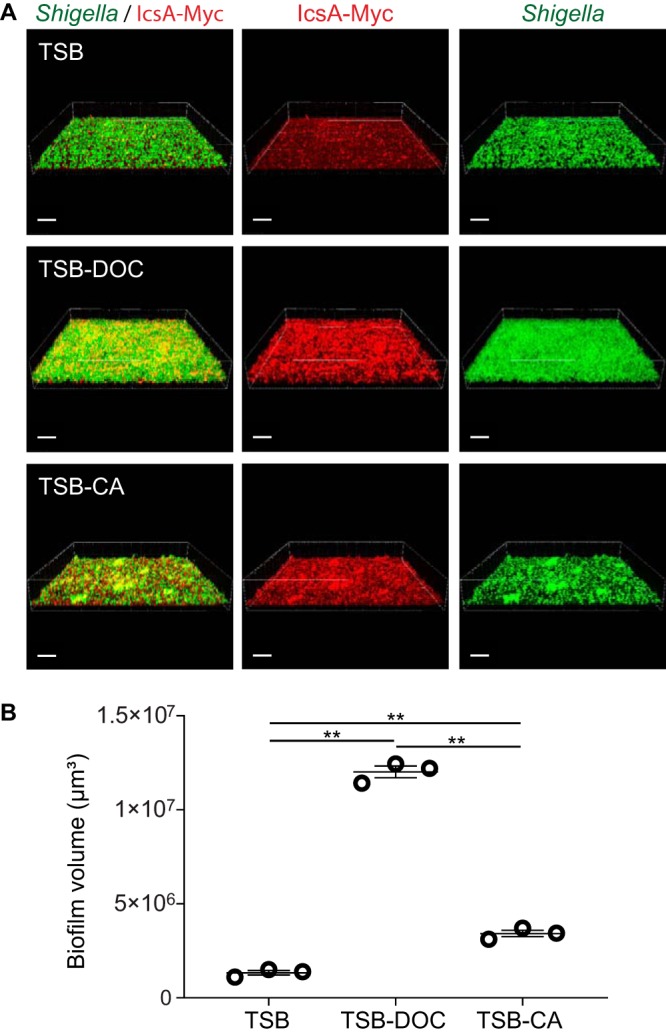
FIG 4.

Biofilm formation in the presence of individual bile salt components. (A) Representative three-dimensional (3D) biofilm images. Bars, 30 μm. Green, Shigella; Red, IcsA-Myc. (B) Quantification of biofilm volume. Symbols in the graph represent the summation of biofilm volume values in 25 fields of view for each biological replicate. One-way ANOVA with Tukey’s multiple-comparison test was applied for statistical analysis using GraphPad Prism 7.02. **, P value of <0.01. Error bars indicate standard errors of the means from three biological replicates.
