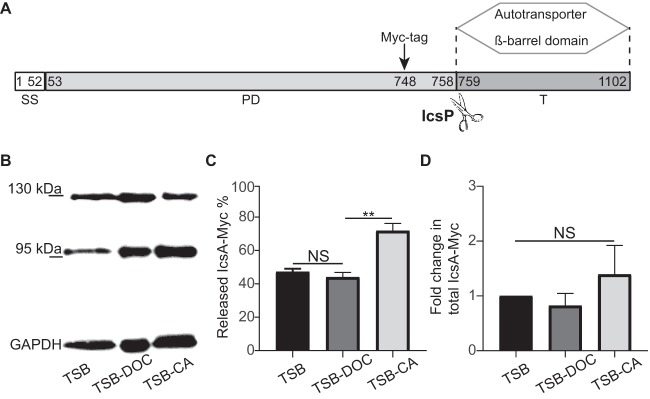
FIG 5.
IcsA species within biofilms formed in the presence of individual bile salts. (A) Domain organization of IcsA. Numbers indicate amino acid residues. The IcsP cleavage site between residues 758 and 759 is indicated by scissors. The Myc tag was inserted at position 748, as previously described (21). SS, signal sequence; PD, passenger domain; T, translocator autotransporter β-barrel domain. (B) Western blot analysis of IcsA-Myc species produced in biofilms. A representative blot image shows IcsA-Myc species in surface-associated Shigella communities that developed after growth in TSB, TSB-DOC, and TSC-CA media. (C) Quantification of cleaved IcsA-Myc as a percentage of total IcsA-Myc (intact IcsA plus cleaved IcsA). One-way ANOVA with Tukey’s multiple-comparison test was applied for statistical analysis using GraphPad Prism 7.02. NS, not significant; **, P value of <0.01. Error bars indicate standard errors of the means from three biological replicates. (D) Quantification of total IcsA-Myc levels (intact IcsA plus cleaved IcsA) in TSB-DOC and TSB-CA relative to TSB. One-way ANOVA with Tukey’s multiple-comparison test was applied for statistical analysis using GraphPad Prism 7.02. NS, not significant. Error bars indicate standard errors of the means from three biological replicates.

