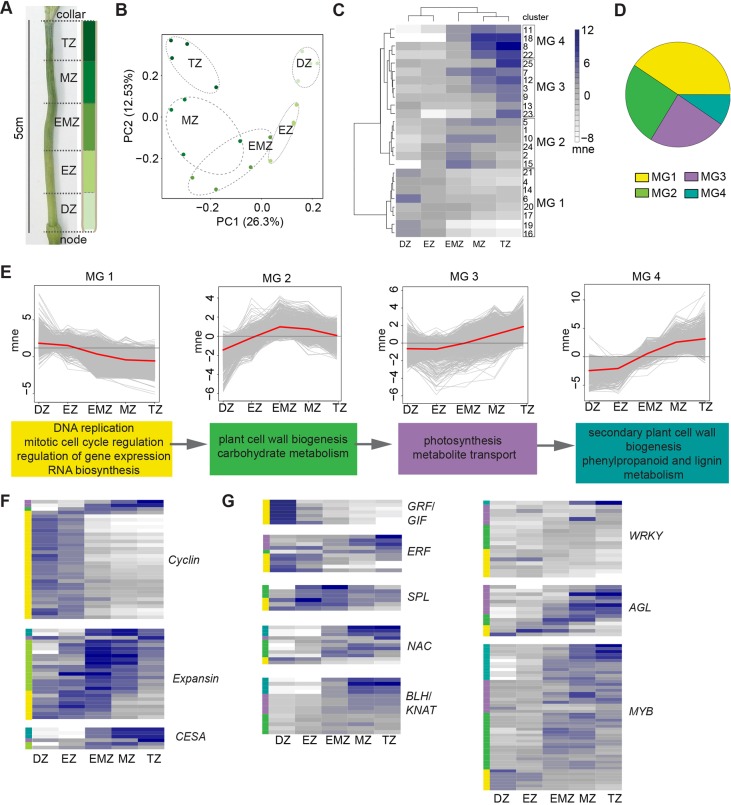
Fig. 4.
Elongating peduncle transcriptome. (A) The 5 cm Bowman peduncle with 1 cm segments classified according to the zonation model. (B) PCA of biological replicates from peduncle segments labelled by zone. (C) Heat map of mean normalised expression of co-expressed clusters showing megaclusters (MGs). (D) Pie chart of differentially expressed genes (DEGs) within each MG. The colour assigned to each MG is consistent throughout the figure. (E) Mean normalised expression profile of each MG in red line. Dark grey line shows mean expression of entire transcriptome and light grey lines show individual DEGs. Colour-coded boxes below each profile show statistically enriched GO terms of the MG. (F,G) Heat maps show mean normalised expression of DEGs encoding cyclins, expansions or cellulose synthases (CESAs) and genes encoding key transcription factor families. Same scale as in C. Coloured bars on the left show the MG assigned to each DEG. Bw, Bowman; DZ, division zone; EZ, expansion zone; EMZ, expansion-maturation transition zone; mne, mean normalised expression; MZ, maturation zone; TZ, termination zone; ERF, ETHYLENE RESPONSE FACTOR; GRF, GROWTH REGULATING FACTOR; GIF, GRF INTERACTING FACTOR; SPL, SQUAMOSA PROMOTER BINDING-LIKE; NAC, NAM/ATAF/CUC; BLH, BEL1-LIKE HOMEODOMAIN; KNAT, KNOTTED-LIKE HOMEODOMAIN; AGL, AGAMOUS-LIKE.

