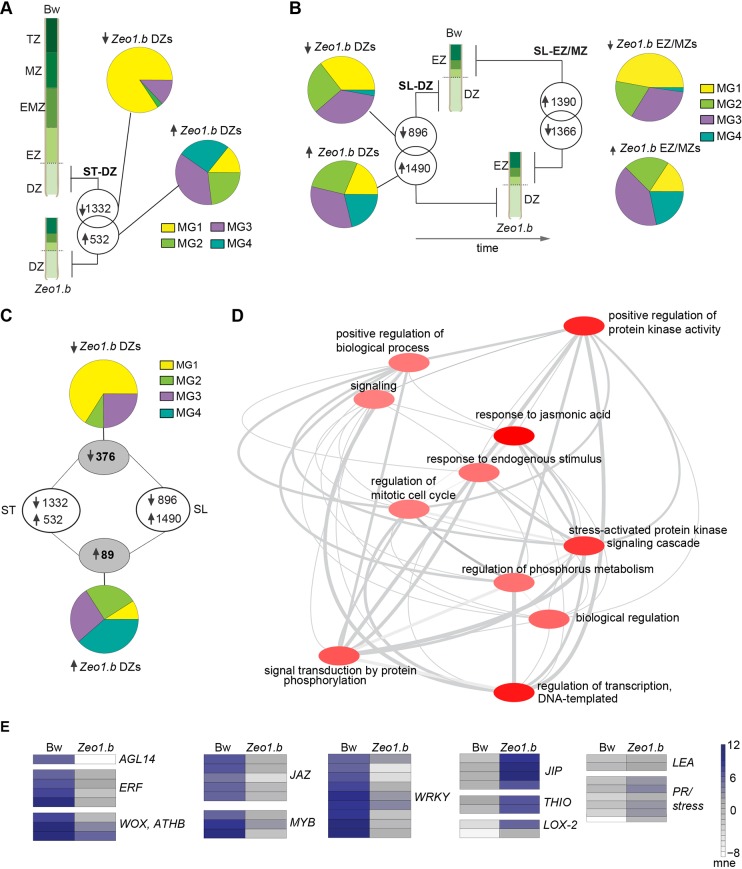
Fig. 5.
Comparative transcriptomes of elongating peduncles. (A) The same time (ST) sampling compared 2 cm Zeo1.b and 5 cm Bowman peduncle division zone (DZ) segments harvested at the same time. Venn diagrams show differentially expressed genes (DEGs) in Zeo1.b compared with Bowman. Pie charts showing the elongating peduncle transcriptome megacluster (MG) association for down- and upregulated DEGs. (B) The same length (SL) sampling compared 2 cm Zeo1.b and 2 cm Bowman peduncle DZ and EZ-MZ segments. Venn diagrams show Zeo1.b DEGs and pie charts showing their MG associations. (C) Numbers in grey circles show shared DEGs between DZs of the ST and SL samplings and their MG association. (D) Interaction network of over-represented GO processes in the shared DZ DEGs. The darker the bubble colour, the lower the P-value. (E) Heat maps of transcription factors and stress-responsive DEGs. Bw, Bowman; DZ, division zone; EZ, expansion zone; EMZ, expansion-maturation transition zone; mne, mean normalised expression; MZ, maturation zone; TZ, termination zone; AGL, AGAMOUS-LIKE; ATHB, ARABIDOPSIS THALIANA HOMEOBOX PROTEIN; ERF, ETHYLENE RESPONSE FACTOR; WOX, WUSCHEL-like homeobox; JAZ, JASMONATE INTERACTING FACTORS; JIP, JAMONATE INDUCED PROTEIN; THIO, THIONIN; LOX2, LIPOXYGENASE2; LEA, LATE EMBRYO ABUNDANT; PR, PATHOGENESIS-RELATED.

