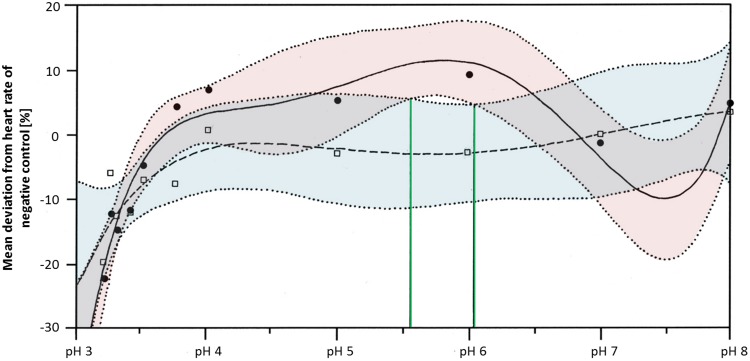
Figure 6. Mean deviation of the heart rate from the negative control in percent as a function dependent on pH; pH control: y = a + bx + cx1.5 + dx2.5 + ex0.5; glyphosate: y = a + bx + cx2 + dex + e (lnx)2.
Colored areas mark the 95% confidence interval. Green lines confine the pH range (between pH 5.55 and pH 6.05) in which the 95% confidence intervals of pH control and glyphosate do not overlap and thus, where heart rates differ significantly from each other.

