Fig. 2.
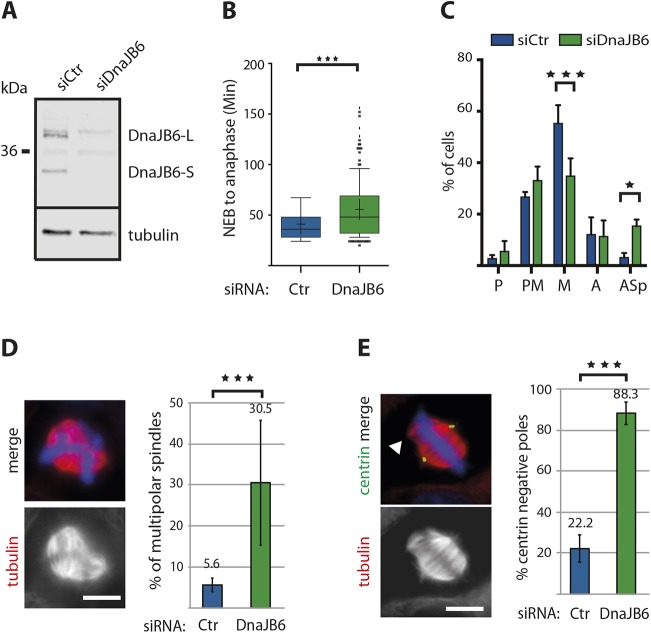
DnaJB6 is required for bipolar spindle assembly. (A) Western blot analysis of control and DnaJB6-silenced cell lysates showing the efficiency of DnaJB6 silencing. Cells were lysed 48 h post transfection and 40 μg of protein were loaded per lane. DnaJB6 silencing efficiency was 90% for DnaJB6-L and more than 90% for DnaJB6-S. Tubulin is blotted as protein loading control. (B) Box-and-whisker plot showing the time from nuclear envelope breakdown (NEB) to anaphase onset for control and DnaJB6-silenced cells. Data are from three independent experiments in which a total of 281 control and 250 DanJB6 silenced cells were analyzed. ***P<0.0001 (Mann–Whitney test). (C) Bar graph showing the mean±s.d. distribution of mitotic phases in control (blue) or DnaJB6-silenced HeLa cells (green). Prophase (P), prometaphase (PM), metaphase (M), anaphase (A) and aberrant spindles (Asp) are quantified. Monopolar, multipolar spindles and more disorganized structures were included into the aberrant spindle category (Asp). Data from three independent experiments in which a total of 454 control and 498 DnaJB6-silenced cells were analyzed. *P<0.05, ***P<0.0001 (ANOVA test). (D) Multipolar spindle are highly represented in DnaJB6-silenced cells. Left: representative image of a DnaJB6-silenced HeLa cell with a multipolar spindle. Tubulin is in red and DNA in blue. Scale bar: 10 μm. Right: quantification (mean±s.d.) of the percentage of multipolar spindles in control (blue) and DnaJB6-silenced (green) cells. The percentages are indicated on top of the columns. Data are from three independent experiments in which a total of 765 control and 778 DnaJB6-silenced cells were analyzed. ***P<0.0001 (Fisher's exact test). (E) DnaJB6-silenced cells present extra poles that are mainly not centrosomal. Left: immunofluorescence images of a DnaJB6-silenced HeLa cell with a multipolar spindle showing tubulin (red), centrin (green) and DNA (blue). The arrowhead points to a centrin negative pole. Scale bar: 10 μm. Right: quantification (mean±s.d.) of the percentage of multipolar spindles with poles negative for centrin in control (blue) and DnaJB6-silenced (green) HeLa cells. The percentages are indicated on top of the columns. Data are from two independent experiments in which a total of 126 control and 116 DnaJB6-silenced cells were analyzed. ***P<0.0001 (ANOVA test).

