Figure 3.

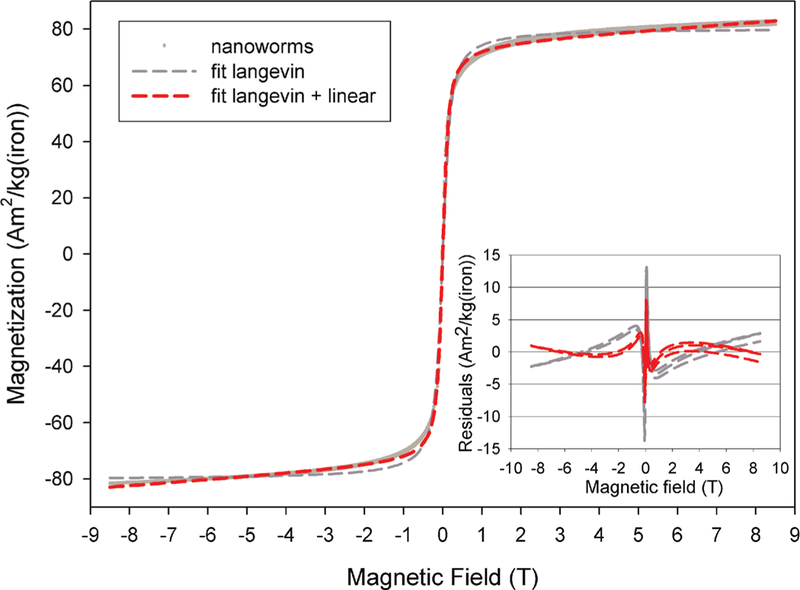
Magnetometric curve of nanoworms obtained at 37°C between –8.5 and 8.5 T. The inset shows the residuals of the fittings of the Langevin function and equation (1) to the data.

Magnetometric curve of nanoworms obtained at 37°C between –8.5 and 8.5 T. The inset shows the residuals of the fittings of the Langevin function and equation (1) to the data.