Figure 49.
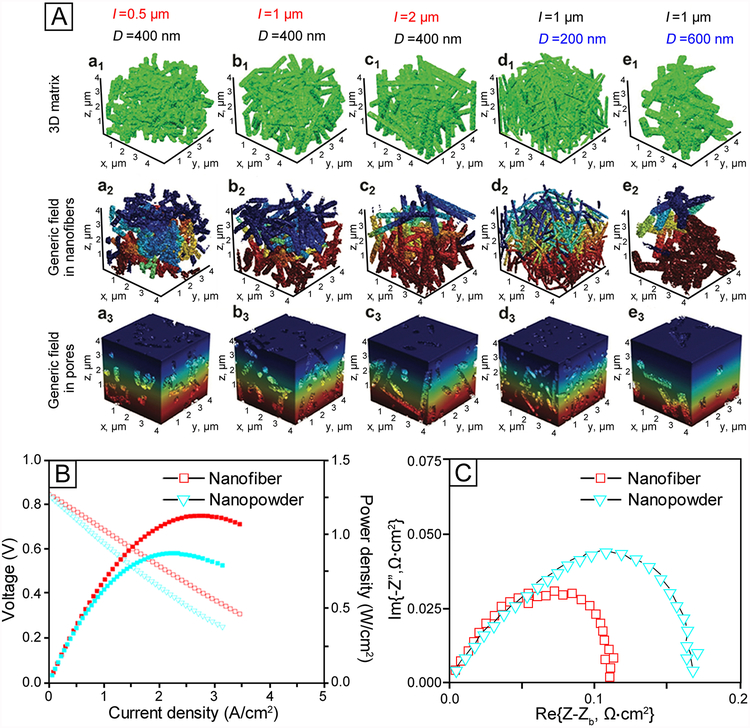
(A) Visualization of (a1−e1) a 3D nanofiber matrix as well as generic field within (a2−e2) nanofibers and (a3−e3) pores. The fibers in panels a−c) had different lengths (0.5, 1, and 2 μm, respectively) at a fixed diameter of 400 nm. The fibers in panels b, d, and e had different diameters (400, 200, and 600 nm, respectively) at a fixed length of 1 μm. (B) Current density−voltage and current density−power curves and (C) impedance spectra of a fuel cell with the cathode made of hollow nanofibers and powders, respectively. (A) Adapted with permission from ref 756. Copyright 2017 Wiley-VCH. (B and C) Adapted with permission from ref 757. Copyright 2016 Elsevier.

