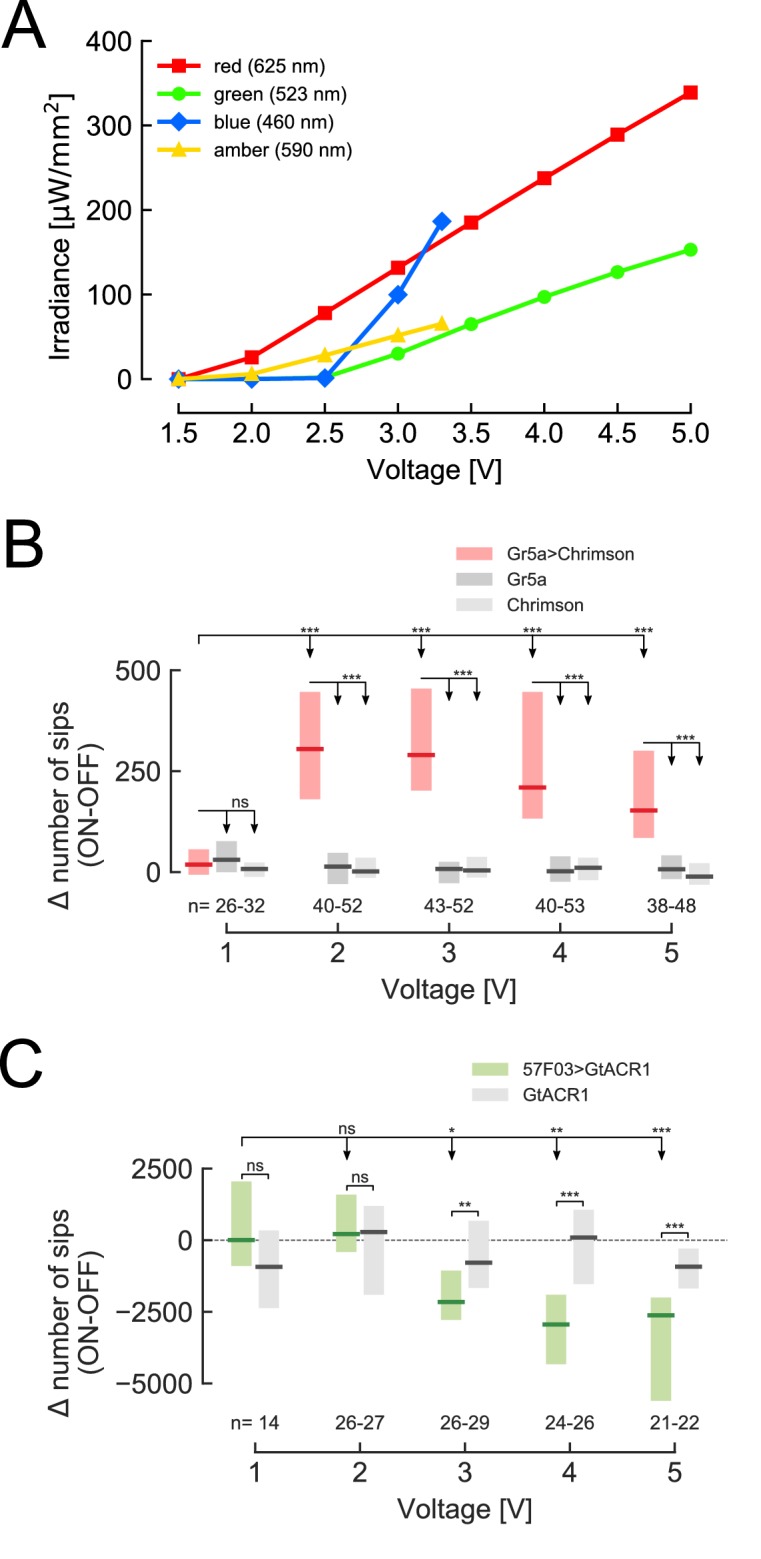
Figure 2. Increasing light intensity affects the feeding behavior of flies expressing different optogenetic effectors.
(A) Irradiance of all four LEDs increases linearly with increasing voltage (for red and amber above 2 V, for green and blue above 2.5 V). The average value of the three measurements is shown and error bars indicate standard error of mean. (B) Difference in total number of sips on the stimulated (ON) and unstimulated (OFF) food patches of the same arena for 24 hr starved male flies expressing CsChrimson under the control of Gr5a-GAL4, and corresponding genetic controls. Both food sources contained 5 mM sucrose solution in 1% agarose. (C) Difference in total number of sips on the stimulated (ON) and unstimulated (OFF) food patches of the same arena for 3 days yeast-deprived, mated female flies expressing GtACR1 under the control of 57 F03-GAL4, which labels taste peg GRNs, and corresponding genetic control. For genotypes, see Materials and methods and key resources table. Both food sources contained 10% yeast solution in 1% agarose. The numbers below the graphs indicate the number of flies tested in each condition. ***p<0.001, **p<0.01, *p<0.05, ns non-significance. Boxes represent median with upper/lower quartiles; groups compared by Wilcoxon rank-sum test, followed by Bonferroni multiple comparison test when more than two groups were compared.

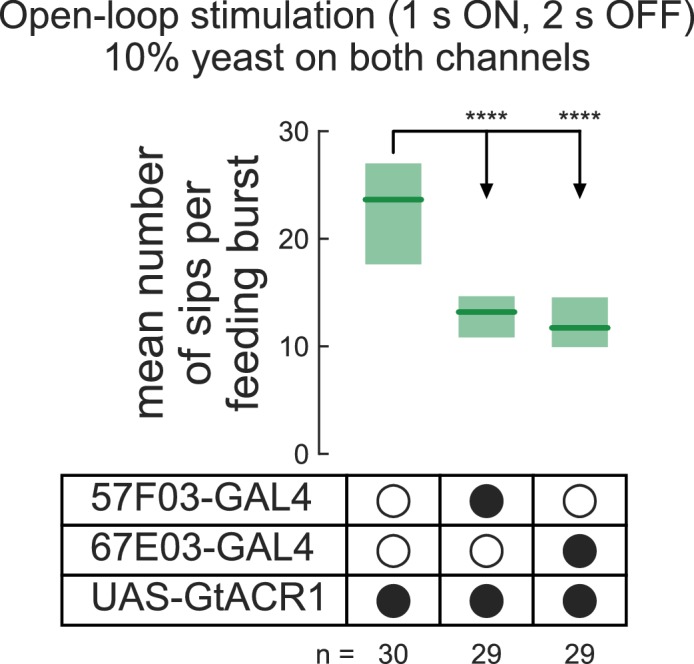
Figure 2—figure supplement 1. Mean number of sips per feeding bursts during open-loop stimulation (1 s ON, 2 s OFF) measured on both food patches of the same arena for 3 days yeast-deprived, mated female flies expressing GtACR1 under the control of 57 F03-GAL4 or 67E03-GAL4, which both label taste peg GRNs, and corresponding genetic control (Steck et al., 2018).

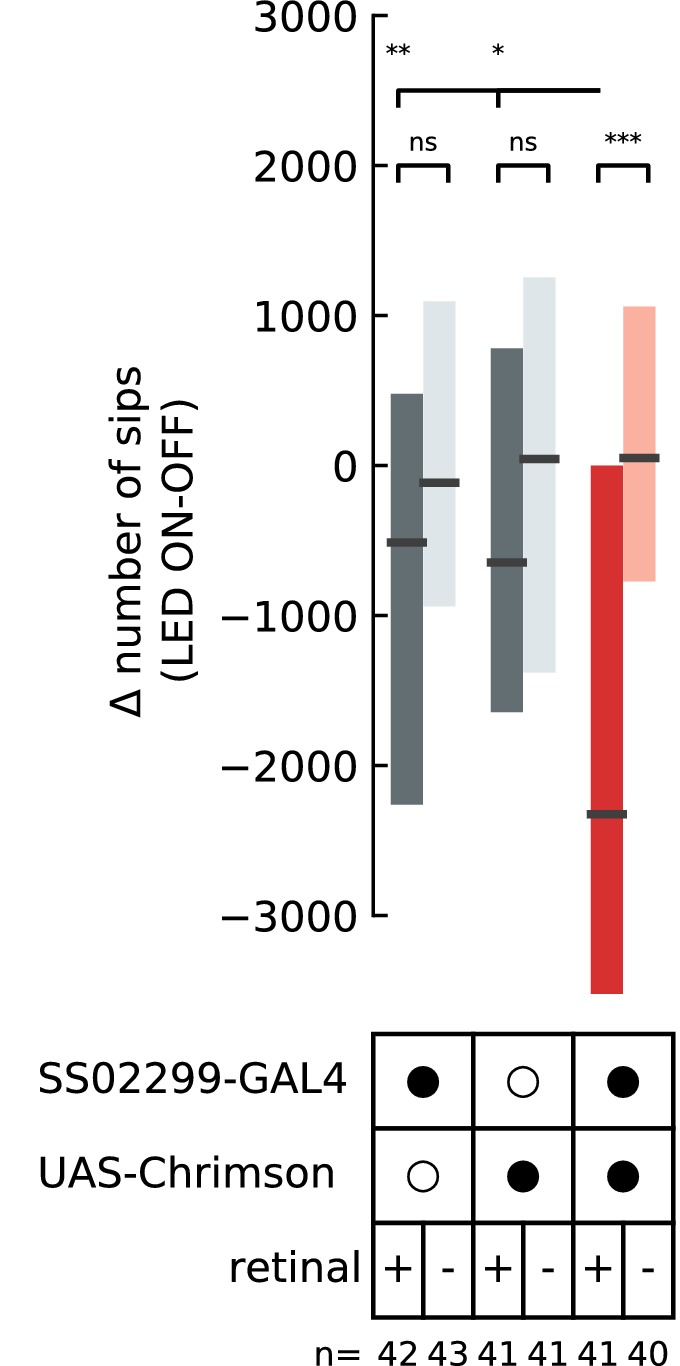
Figure 2—figure supplement 2. Difference in total number of sips on the stimulated (ON) and unstimulated (OFF) food patches of the same arena for 3 days yeast-deprived, mated female flies expressing CsChrimson under the control of SS02299-GAL4, and corresponding genetic controls.

