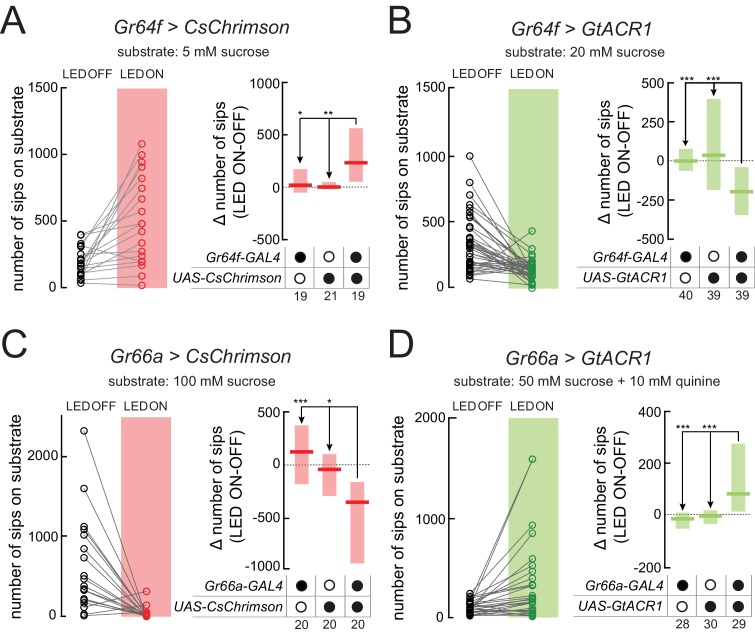
Figure 3. Creating virtual taste realities for Drosophila using the optoPAD.
(A–D) Total number of sips from the unstimulated (LED OFF) and the light-stimulated (LED ON) food patches of the same arena by flies expressing CsChrimson (A and C) or GtACR1 (B and D), under the control of Gr64f-GAL4 (A and B) or Gr66a-GAL4 (C and D) (left side of the panels). Difference in total number of sips on the stimulated (ON) and unstimulated (OFF) food patches for flies expressing CsChrimson or GtACR1 (A and C), under the control of Gr64f-GAL4 (A and B) or Gr66a-GAL4 (C and D), and corresponding genetic controls (right side of the panels). All flies were 24 hr starved male flies (for genotypes, see Materials and methods and key resources table). The food substrate is indicated in each panel. The numbers below the graphs indicate the number of flies tested in each condition. ***p<0.001, **p<0.01, *p<0.05. Boxes represent median with upper/lower quartiles; groups compared by Kruskal-Wallis test, followed by Dunn’s multiple comparison test.

