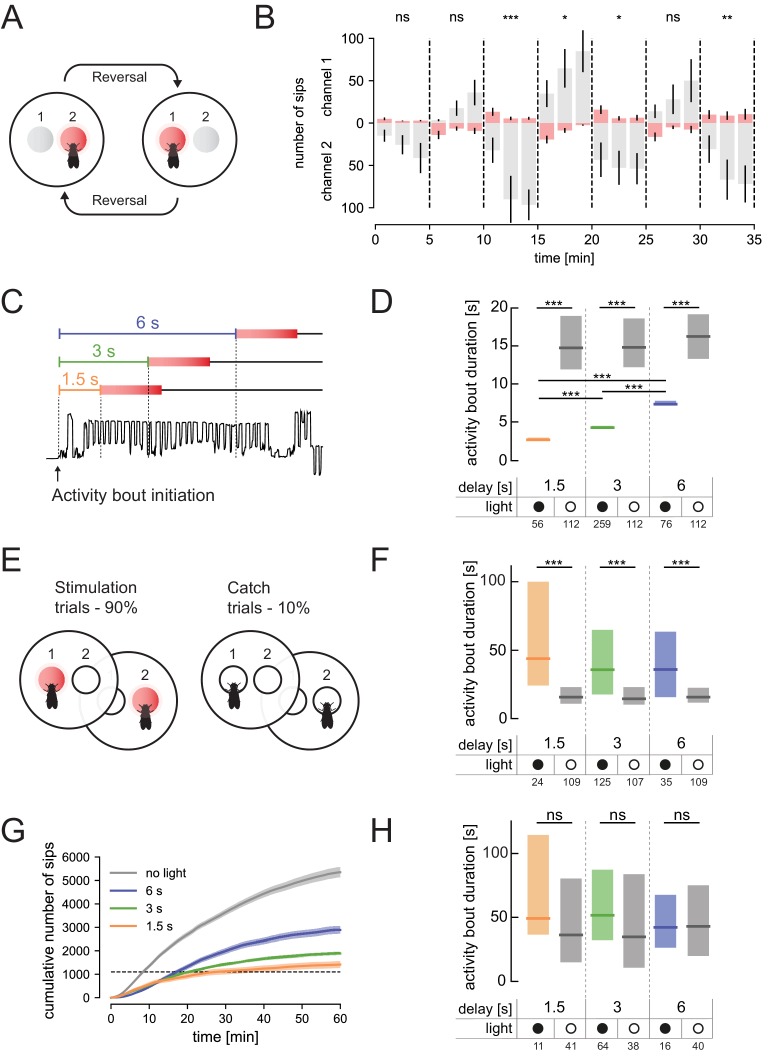
Figure 4. The optoPAD allows for complex dynamic closed-loop experimental designs.
In all experiments, 5–7 days old female Gr66a-GAL4 > CsChrimson flies were used. (A) Schematic overview of the dynamic virtual taste reality experiment: every five minutes the contingency of the experiment is reversed (in each experimental block the fly’s interaction with a different channel triggered light stimulation). (B) Number of sips from channel 1 (upper half of the plot) and channel 2 (lower half of the plot) across time in the changing virtual taste reality setting described in A. Columns and lines represent mean and the standard error of the mean, respectively. The trials leading to LED activation are shaded in red. (C) Onset of light stimulation (red box) can be freely set to occur at different times after the initiation of an interaction with food (delay of 1.5, 3 and 6 s). The lower part of the diagram represents a representative capacitance trace with the onset of food contact marked with an arrow. (D) Duration of activity bouts in flies exposed to light after different delays relative to the initiation of food interactions and corresponding controls (experimental design described in C). Plotted are the duration of activity bouts for the stimulated flies (light) and for the same number of trials that were longer than 1.5, 3 and 6 s (from left to right) performed by the ‘no light’ control flies. (E) Schematic of the experimental design in which light activation was set to happen in a probabilistic manner. (F) Duration of activity bouts of the catch trials. Plotted are the duration of activity bouts for the stimulated flies (light) and for a selection of 10% of all the trials that were longer than 1.5, 3 and 6 s (from left to right) performed by the ‘no light’ control flies. (G) Cumulative feeding for the four different groups of the experiment described in (E). Line represents the mean and the shading the standard error of the mean. Dotted line indicates the 1100 sips threshold used to calibrate the data for the internal state of the animal. (H) Duration of activity bouts of the catch-trials for sip-calibrated flies (trials performed until the flies had reached a total of 1100 sips). Plotted are the duration of activity bouts for the stimulated flies (light) and for a selection of 10% of all the trials that were longer than 1.5, 3 and 6 s (from left to right) performed by the ‘no light’ control flies. For genotypes, see Materials and methods and key resources table. ***p<0.001, **p<0.01, *p<0.05, ns non-significance. The numbers below the graphs in D, F and H indicate the number of flies tested in each condition. In D, F, and H, boxes represent median with upper/lower quartiles. In D, F and H, groups were compared by Kruskal-Wallis test, followed by Dunn’s multiple comparison test. In B, the total number of sips for all bins in each channel during each period of 5 min was compared by Wilcoxon rank-sum test.


