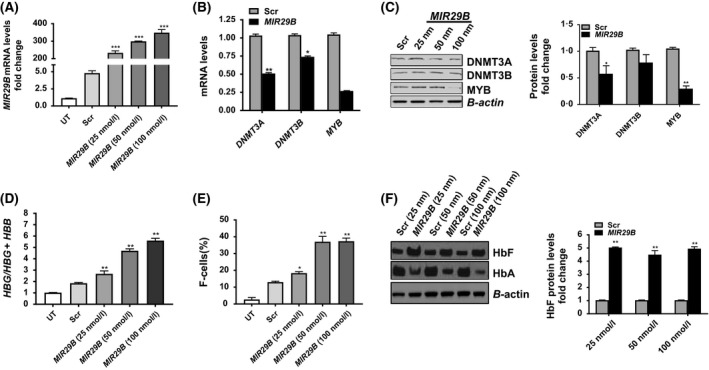
Figure 1.

MIR29B regulates HBG gene expression in KU812 cells. (A) Fold change of MIR29B expression in KU812 cells following transfection for 48 h with miR‐29b mimic or Scr control by reverse transcription‐quantitative polymerase chain reaction (RT‐qPCR) analysis. The expression of MIR29B level in Scr control was set to one after normalization to endogenous SNORD48 levels. For all studies, the quantitative data are shown as the mean ± standard error of the mean (SEM) of 3 to 5 independent experiments. *P < 0·05, is considered statistically significant; ***P < 0·001. (B) Fold change of DNMT3A,DNMT3B, and MECP2 expression by RT‐qPCR analysis after MIR29B 100 nmol/l (black bars) or Scr (grey bars) mimic transfection into KU812 cells. (C) Western blot for the proteins shown was completed in KU812 cells transfected with MIR29B (black bars) and Scr control (grey bars); β‐actin was used as the internal control; **P < 0·01. (D) The mRNA levels of HBG and HBB in KU812 cells was quantified by RT‐qPCR and calculated as the ratio: HBG/HBG + HBB for the different conditions. (E) Flow cytometry analysis was completed to determine the % HbF positive cells (F‐cells) after staining with fluorescein isothiocyanate labelled anti‐HbF antibody. Shown in the graph is the quantitative data generated by FlowJo analysis. (F) Western blot of HbF and haemoglobin A (HbA) relative to β‐actin protein levels in KU812 cells transfected with MIR29B mimic or Scr control at the concentrations shown. Scr, scramble; UT, untreated.
