Figure 3.

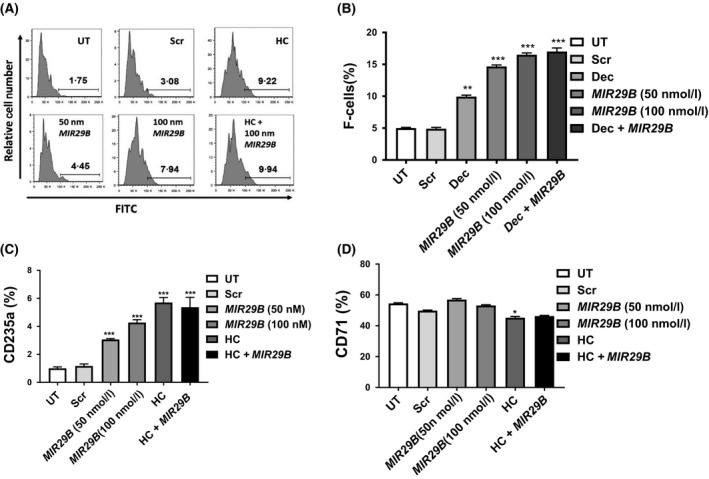
MIR29B increases expression of the late erythroid marker GYPA during erythropoiesis. (A) Shown is representative histograms generated by flow cytometry analysis of erythroid progenitors under untreated (UT), scrambled (Scr), hydroxycarbamide (HC) or MIR29B treatment conditions. (B) F‐cell levels were determined by flow cytometry. Shown in the bar graph is the quantitative data generated by FlowJO analysis. (C and D) Shown in the graphs are data obtained by reverse transcription‐quantitative polymerase chain reaction analysis of RNA isolated from erythroid progenitors under the various treatment conditions using gene‐specific primers for erythroid differentiation markers GYPA (glycophorin A) and TFRC (transferrin receptor). FITC, fluorescein isothiocyanate; HC, hydroxycarbamide; Scr, scramble; UT, untreated. *P < 0·05, **P < 0·01, ***P < 0·005
