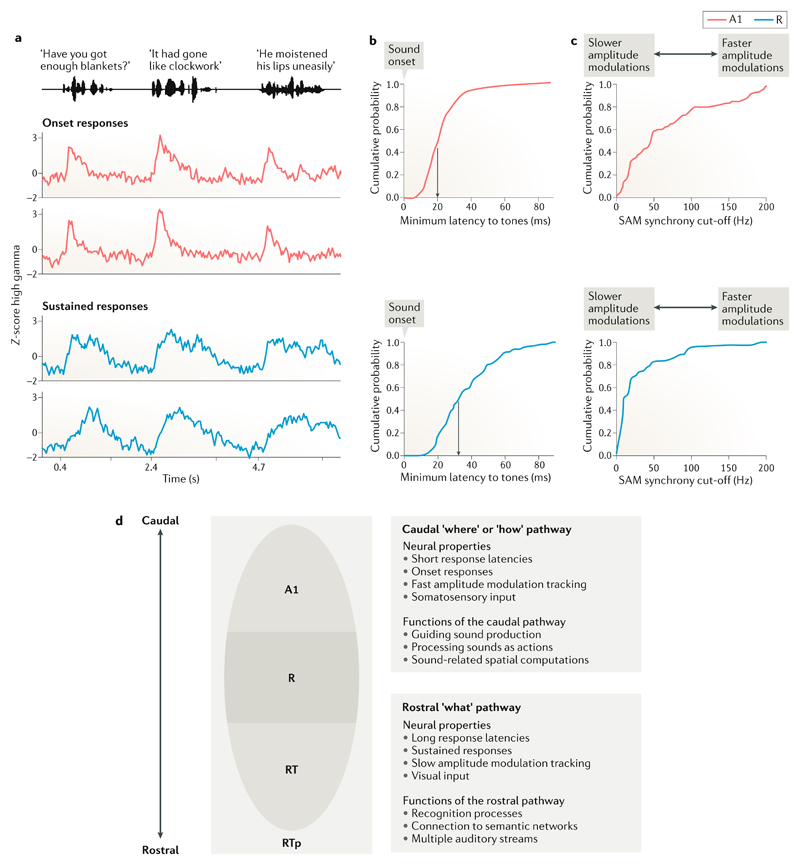
Fig. 2. Response properties of the rostral and caudal auditory cortex.
a | Examples of electrocorticography responses to sentences that have been categorized as ‘sustained’ and ‘onset’ responses on the basis of machine learning classifications. Caudal fields (red traces) show transient responses associated with the onset of complex sequences and rostral fields (blue traces) show sustained responses. These distinctions were found bilaterally31. b | Minimum response latencies (that is, the fastest responses to sound onsets) in caudal core field A1 (top, red) and rostral core field R (bottom, blue). The median response in caudal A1 is faster (at 20 ms) than that in rostral R (33 ms)14. c | Neural responses to increasing rates of sinusoidal amplitude modulation (SAM) in caudal core field A1 (top) and rostral core field R (bottom). The SAM synchrony cut-off reflects the amplitude modulation rate at which a neuron’s synchronization to the amplitude envelope can no longer be detected. Note that the responses saturate at a much lower amplitude modulation frequency in rostral field R (median 10 Hz) than in caudal field A1 (median 46 Hz), indicating that the responses in A1 can track amplitude changes at a much faster rate than can R14. d | Schematic of the auditory cortex showing candidate functional distinctions in rostral and caudal areas. RT, rostral temporal core field; RTp, rostrotemporal polar belt area. Part a is adapted with permission from REF.31, Elsevier. Parts b and c are adapted with permission from REF.14, American Physiological Society.

