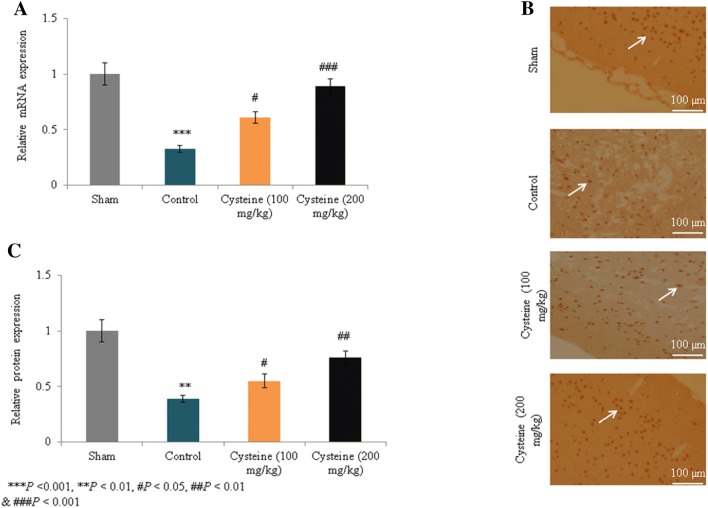
Fig. 5.
Effects of l-cysteine on the mRNA and protein expression levels of (MAP2) in a rat model of TBI. a Relative mRNA expression of MAP2. b Immunohistochemical images of MAP2. c Relative protein expression of MAP2. All experimental data are presented as a mean and a standard deviation (n = 6); all statistical analyses were performed with an ANOVA. ***P < 0.001 compared to the sham rats; ###P < 0.001, ##P < 0.01, and #P < 0.05 compared to the control rats (TBI). Scale bar: 100 µm. (Magnification, × 20)

