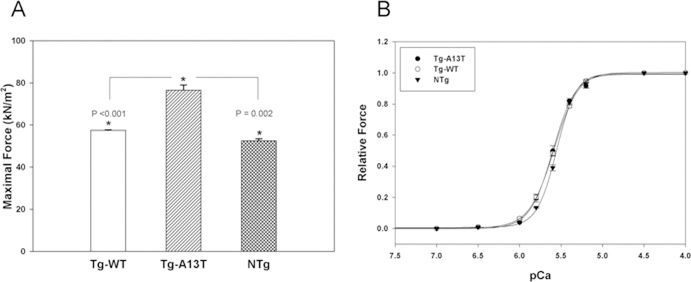
Figure 4. Maximal steady-state force (A) and force–pCa measurements (B) in Tg-A13T, Tg-WT and NTg skinned muscle fibres.
A 30% increase in maximal force (expressed per cross-sectional area of muscle fibres) was observed for Tg-A13T mice compared with controls, Tg-WT or NTg (A). The increase in maximal force was not accompanied by any changes in the force–pCa dependence, and no significant differences in the pCa50 values were observed between Tg-A13T and control fibres (B). The data were derived from measurements on 5–11 individual skinned muscle fibres. * indicates significant differences in force between Tg-A13T and control mice.

