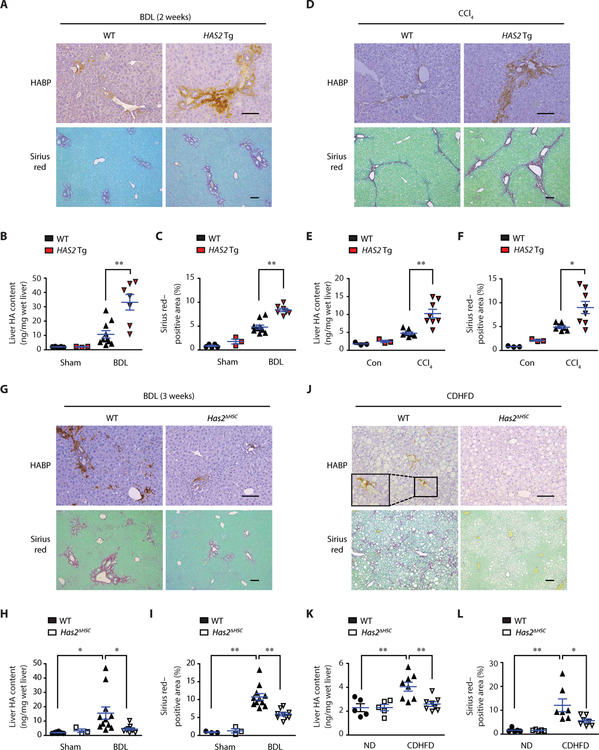
Fig. 3. HSC-derived HAS2 promotes liver fibrosis.
(A) Representative images of HA and Sirius red staining of sections of mouse liver. Mice underwent BDL for 2 weeks (Sham-WT, n = 5; Sham-Tg, n = 3; BDL-WT, n = 10; BDL-Tg, n = 7). (B) Liver HA content by enzyme-linked immunosorbent assay (ELISA). (C) Sirius red–positive area (collagen) from (A). (D) HA and Sirius red staining of sections of mouse liver. Mice were injected with corn oil (Con) or CCl4 intraperitoneally twice a week for 5 weeks (Con, n = 3 per group; CCl4-WT, n = 7; CCl4–ASMA-HAS2 Tg, n = 8). (E) Liver HA content by ELISA. (F) Sirius red–positive area from (D). (G) Representative images of HA and Sirius red staining of sections of mouse liver (Sham-WT, n = 8; Sham-Has2ΔHSC, n = 3; BDL-WT, n = 11; BDL-Has2ΔHSC, n = 9). (H) Liver HA content by ELISA. (I) Quantification of Sirius red–positive area from (G) (Sham groups, n = 3, each). (J) HA and Sirius red staining of sections of mouse liver. Mice were fed with ND or CDHFD for 12 weeks. (K) Liver HA content by ELISA (ND, n = 5 per group; CDHFD, n = 8 per group). (L) Sirius red–positive area from (J) (ND, n = 5 per group; CDHFD, n = 7 per group). Data are means ± SEM. *P < 0.05 and **P < 0.01. One-way ANOVA with Tukey’s post hoc analysis. Scale bars, 100 μm.

