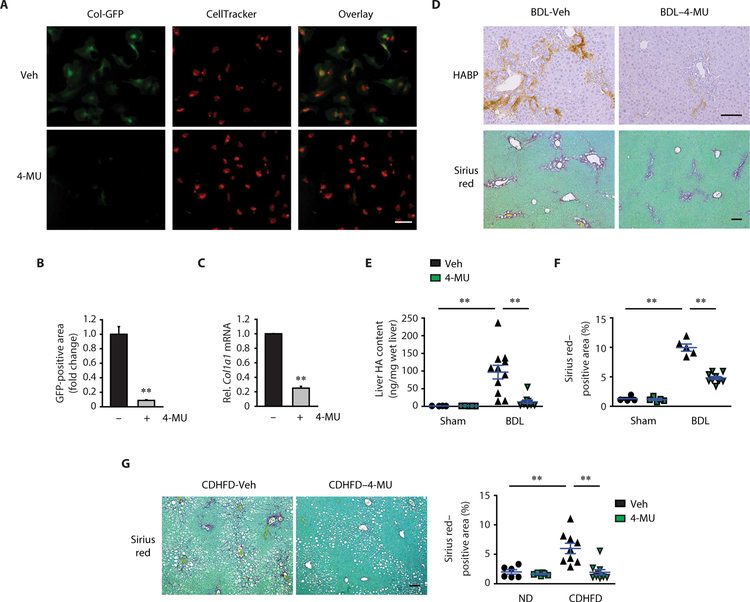
Fig. 8. 4-MU treatment prevents liver fibrosis progression.
(A) Representative immunofluorescence staining images. HSCs were isolated from Col-GFP mice. Two days after seeding, cells were treated with either vehicle (Veh) or 0.5 mM 4-MU for 6 days. (B) Quantification of GFP-positive area in (A) by ImageJ (n = 3). (C) Col1a1 mRNA expression (n = 3). (D) Representative images of HA and Sirius red staining in mouse liver. One week after BDL, mice were orally gavaged with either Veh or 4-MU (450 mg/kg) once daily for 2 weeks. (E) Liver HA content after 4-MU treatment (Sham-Veh, n = 4; Sham–4-MU, n = 5; BDL-Veh, n = 11; BDL–4-MU, n = 10). (F) Quantification of Sirius red staining in (D) (Sham-Veh, n = 4; Sham–4-MU, n = 5; BDL-Veh, n = 5; BDL–4-MU, n = 10). (G) Sirius red staining in mouse liver. At 11 weeks of CDHFD feeding, mice were orally gavaged daily with Veh or 4-MU (450 mg/kg) for 4 weeks (ND, n = 6 per group; CDHFD-Veh, n = 9; CDHFD–4-MU, n = 10). Data are means ± SEM. **P < 0.01. Two-tailed Student’s t test (B and C) and one-way ANOVA with Tukey’s post hoc analysis (E to G). Scale bars, 100 μm.

