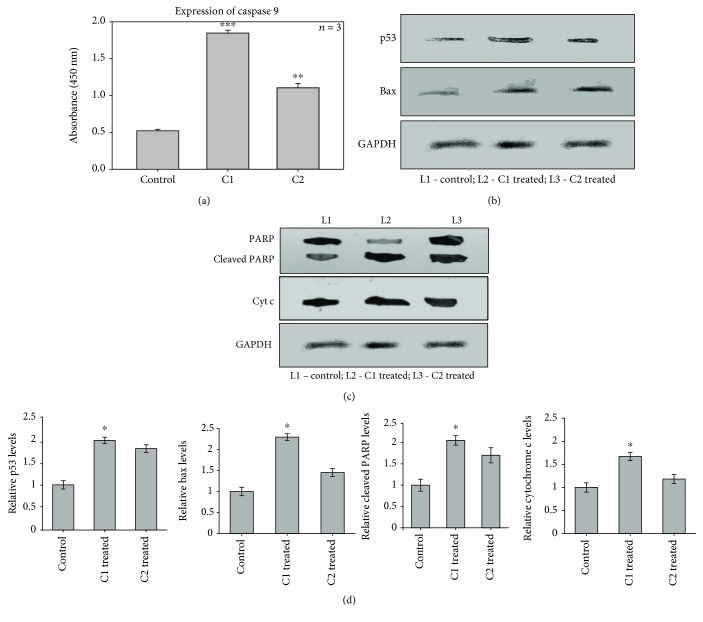
Figure 10.
Expression of apoptotic proteins. (a) The effect of C1 and C2 on the expression of caspase 9 by ELISA. (b, c) The effect of C1 and C2 on the expression of p53, Bax, cleaved PARP, and cytochrome c by western blotting (L1: control; L2: C1 treated; L3: C2 treated). (d) The relative expression levels of p53, Bax, cytochrome c, and cleaved PARP. The results showing that apoptotic proteins such as caspase 9, p53, Bax, cytochrome c, and cleaved PARP levels were significantly increased in C1-treated groups than C2 and control cells.

