Figure 4.
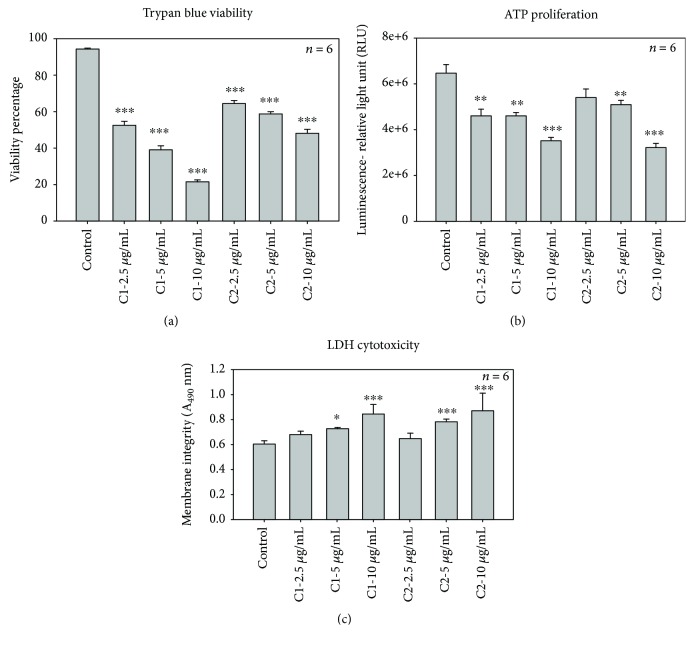
Effect of C1 and C2 on cellular viability, proliferation, and cytotoxicity. (a) Trypan blue viability. Trypan blue viability test showed a significant (∗∗∗p < 0.001) decrease in the viability of the MCF-7 cells after C1 and C2 treatment compared to the control cells. (b) The ATP proliferation assay. ATP luminescent cell assay was used to determine MCF-7 cell proliferation after the treatment with C1 and C2. Control cells showed an increased ATP level, whereas a dose-dependent significant (∗∗∗p < 0.001 and ∗∗p < 0.01) decrease in ATP level was observed in both experimental groups. (c) The lactate dehydrogenase (LDH) cytotoxicity. The LDH cytotoxicity test showed a significant increase in cytotoxicity of cells after the 24 h treatment with C1 and C2 compared to control cells. The significant differences between the treated and control groups are shown as ∗∗∗p < 0.001 and ∗p < 0.05.

