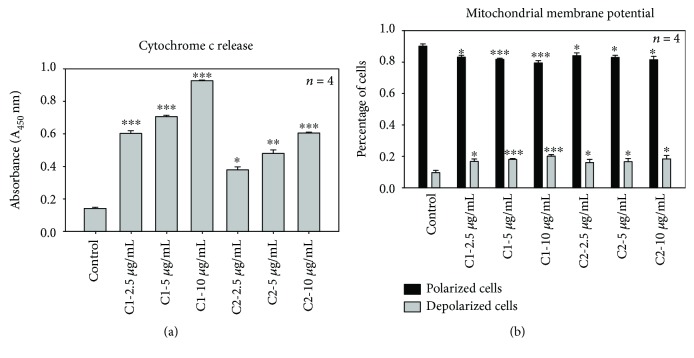
Figure 6.
Effect of C1 and C2 on cytochrome c release and mitochondrial membrane potential. (a) Cytochrome c release. Cytochrome c release is an important measure of cellular damage. C1-treated cells showed significant (∗∗∗p < 0.001) release of cytochrome c compared to C2 and control cells. The significant differences between the treated and control groups are shown as ∗∗∗p < 0.001, ∗∗p < 0.01, and ∗p < 0.05. (b) Mitochondrial membrane potential. Mitochondrial membrane potential evaluation using the flow cytometric analysis of JC-1 fluorometric stain. Percentages of polarized (black) and depolarized (grey) mitochondrial membrane potential were determined and compared to the percentage of the corresponding control cells. C1- and C2-treated cells showed a significant change in mitochondrial membrane potential (∗∗∗p < 0.001).

