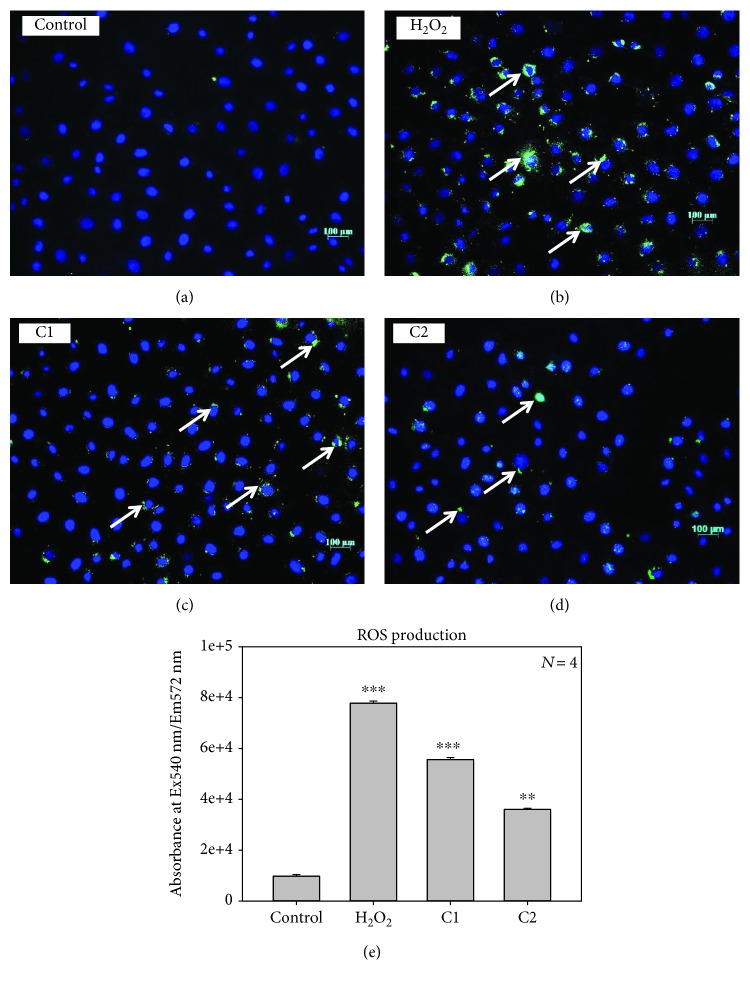
Figure 7.
Effect of C1 and C2 on ROS production. ROS production were analysed by DCFH-DA staining in MCF-7 cells: (a) control; (b) positive control: H2O2; (c) C1: 4.69 μg/mL treated; (d) C2: 8.36 μg/mL treated. The green color indicates the fluorescence of detected ROS production and blue color indicates the nuclear stain-DAPI. C1-treated cells showed increased ROS production than C2-treated cells. (e) Quantitative ROS production analysis using ELISA showing significant ROS production upon treatment with C1 (∗∗∗p < 0.001) and C2 (∗∗p < 0.01).

