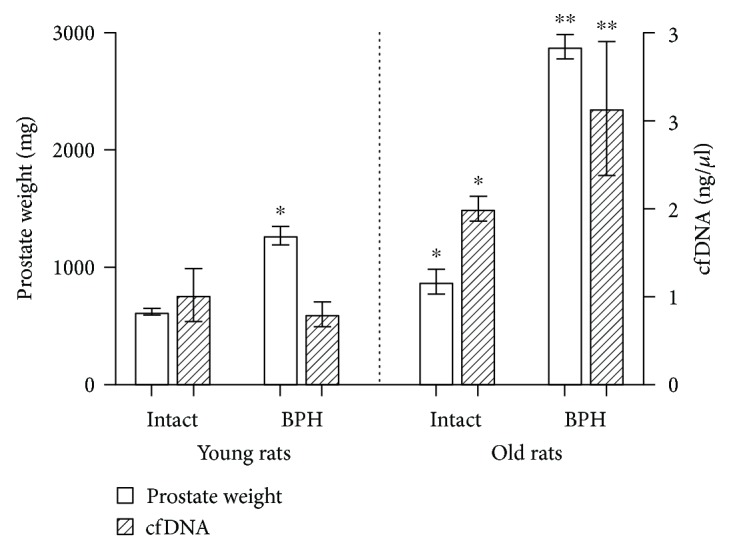
Figure 2.

Prostate weight and cell-free DNA content. Statistical difference: ∗from intact young rats (BPH p < 0.001, intact old p < 0.05 for prostatic weight, and p < 0.05 for cfDNA); ∗∗from young BPH rats and intact old rats (prostatic weight p < 0.001 from intact old rats, p < 0.001 from young BPH, cfDNA p < 0.01 from young BPH, and p < 0.05 from intact old).
