Figure 1.

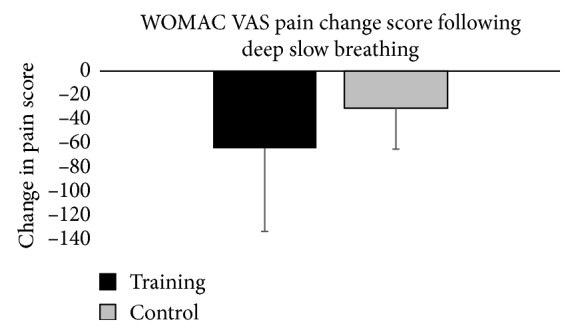
Graphical representation of change in WOMAC pain scores from pretest to posttest for each group. The error bars represent the standard deviation of measurements.

Graphical representation of change in WOMAC pain scores from pretest to posttest for each group. The error bars represent the standard deviation of measurements.