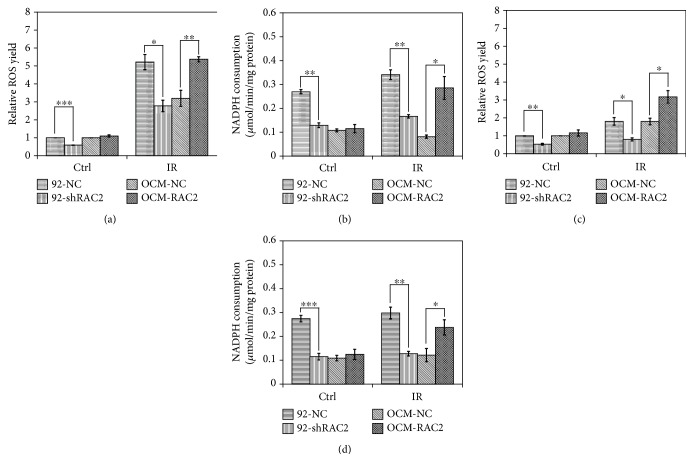
Figure 2.
The effects of RAC2 on the ROS yield and NADPH oxidase activity of the 4 cell lines exposed to 2 Gy X-rays or 2 Gy carbon ion beams. (a) The ROS yields in the 4 cell lines were measured after X-ray exposure. (b) NADPH consumption in the 4 cell lines after X-ray exposure. (c) The ROS yields in the 4 cell lines were measured after carbon ion beam exposure. (d) NADPH consumption in the 4 cell lines after carbon ion beam exposure. ∗ p < 0.05, ∗∗ p < 0.01, and ∗∗∗ p < 0.001.

