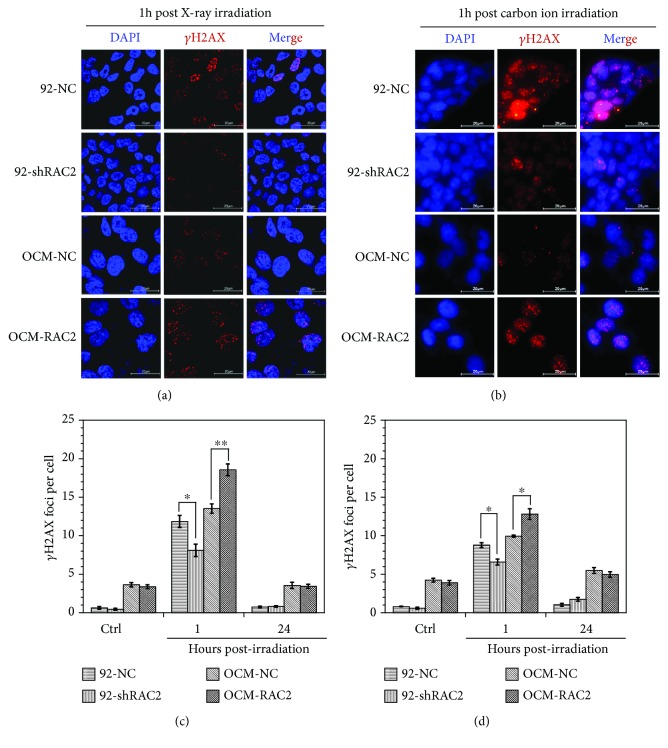
Figure 3.
The γH2AX levels in the 4 cell lines exposed to 0.5 Gy X-rays or 0.5 Gy carbon ion beams. (a) Immunofluorescent staining of the γH2AX in the cells exposed to 0.5 Gy X-rays. (b) Immunofluorescent staining of the γH2AX in the cells exposed to 0.5 Gy carbon ion beams. (c) The γH2AX yields in the cells after X-ray exposure. (d) The γH2AX yields in the cells after carbon ion beam exposure. ∗ p < 0.05 and ∗∗ p < 0.01.

