Figure 10.
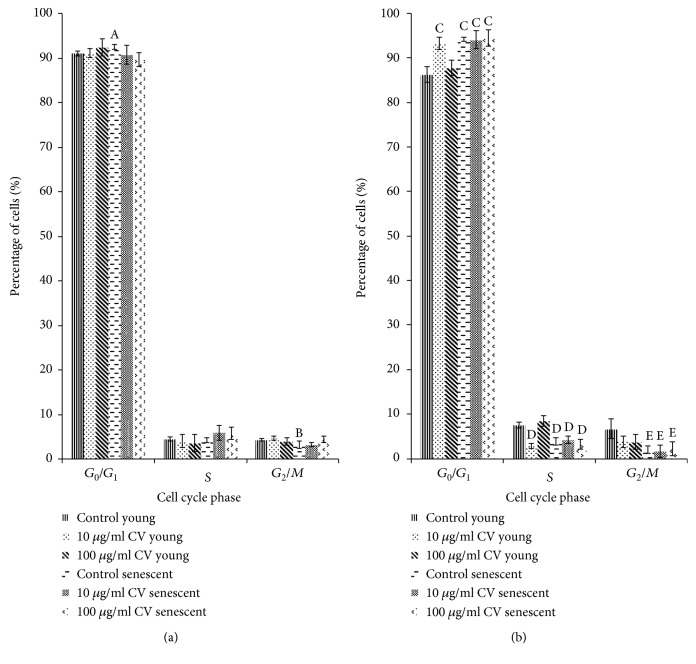
Cell cycle tests were performed on days 0 and 1 of differentiation to determine the myoblast cell population after the induction of differentiation and the effects of treatment with C. vulgaris. Cell populations of young and senescent myoblasts both untreated and treated with C. vulgaris on (a) day 0 and (b) day 1. The data are presented as means ± SD, n = 3. Ap < 0.05: significantly different compared to young control myoblasts in the G0/G1 phase on day 0; Bp < 0.05: significantly different compared to young control myoblasts in the G2/M phase on day 0; Cp < 0.05: significantly different compared to young control myoblasts in the G0/G1 phase on day 1; Dp < 0.05: significantly different compared to young control myoblasts in the S phase on day 1; Ep < 0.05: significantly different compared to young control myoblasts in the G2/M phase on day 1, with a post hoc Tukey HSD test.

