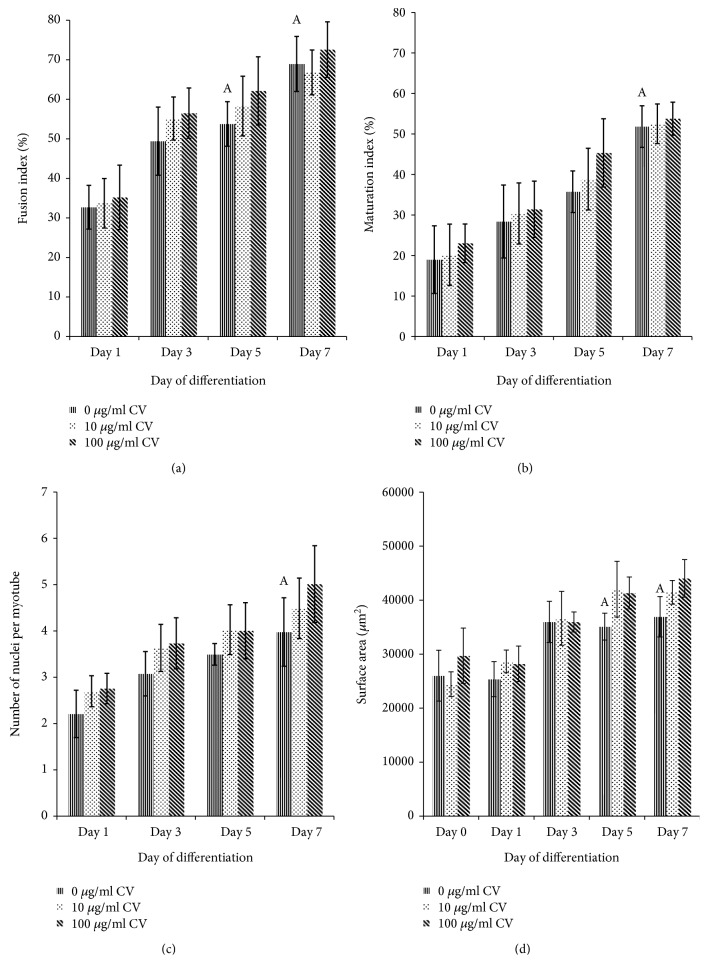
Figure 8.
Index of differentiation for senescent myoblasts. The fusion indexes (a), maturation indexes (b), myotube sizes (c), and myotube surface areas (d) of senescent myoblasts. The data are presented as the means ± SD, n = 3. Ap < 0.05: significantly different compared to senescent control myoblasts on day 1, with a post hoc Tukey HSD test.

