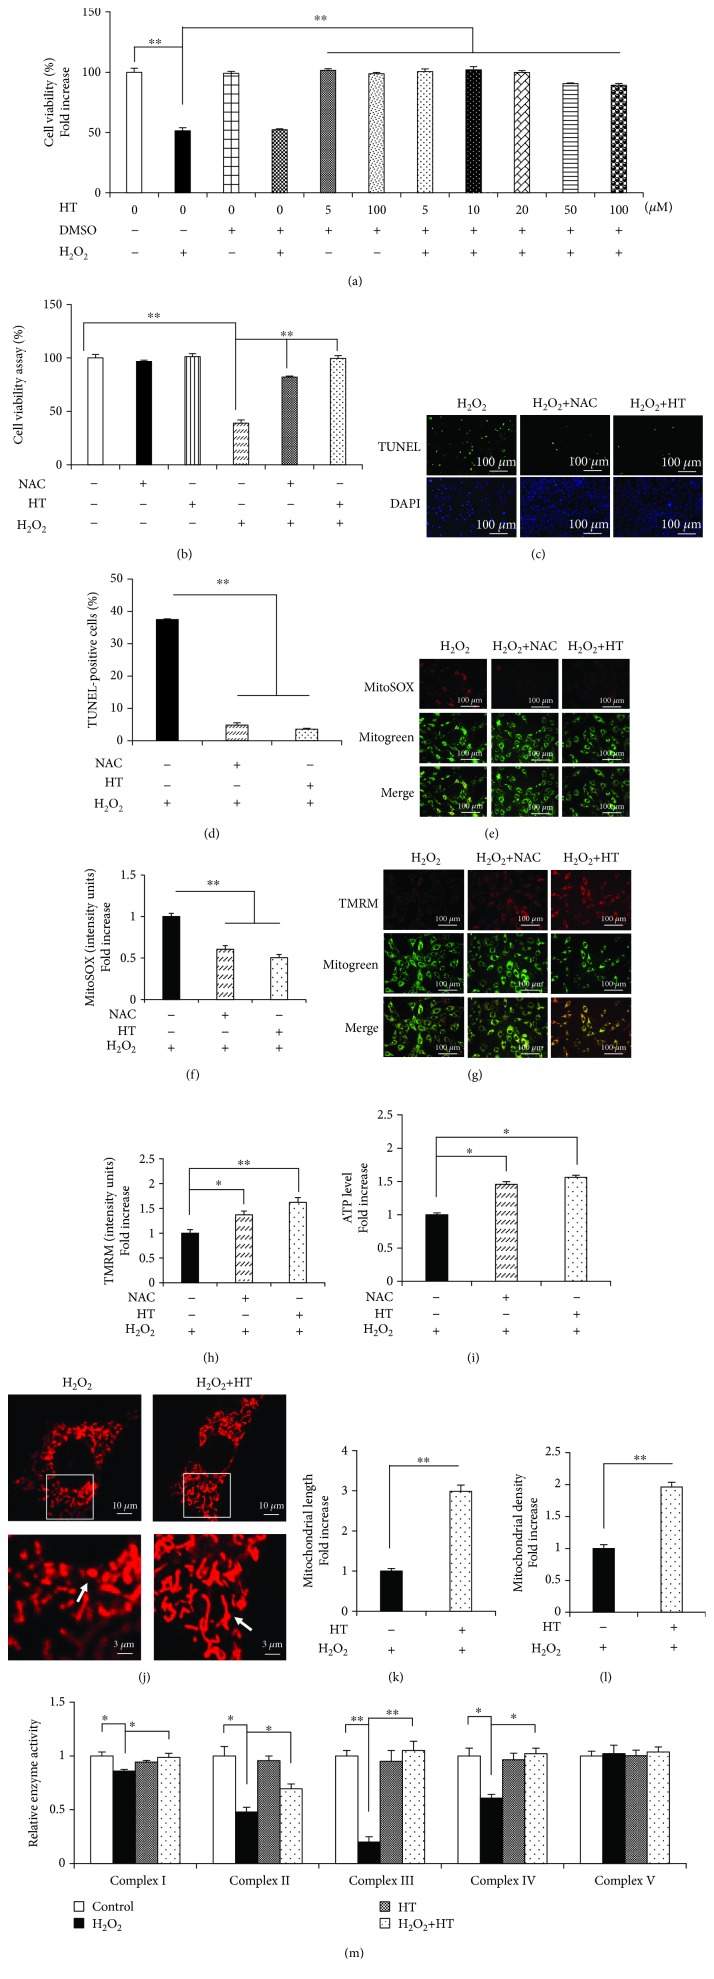
Figure 2.
HT prevents osteoblast apoptosis and mitochondrial dysfunction. (a) Cell viability was determined by performing the MTT assay. Error bars indicate SD (n = 6). (b) Cell viability was determined based on MTT reduction in the osteoblasts treated with (+) or without (-) HT in the presence of H2O2 (+) or NAC (+). Error bars indicate SD (n = 6). (c, d) TUNEL assay was performed to determine the rate of cell apoptosis. Error bars indicate SD (n = 300); scale bars, 100 μm. (e, f) Representative images showing MitoSOX staining and quantification in the indicated groups; scale bar, 100 μm. (g, h) Representative images showing TMRM staining and quantification in the indicated groups. MT Green staining was performed to show the mitochondria; scale bar, 100 μm. (i) ATP levels were determined in the presence or absence of HT or NAC. (j–l) Representative images showing mitochondrial morphology, length, and density in the indicated groups. Error bars indicate SD (n = 3); scale bars, 10 μm. (m) Activity of the mitochondrial complexes in the indicated groups. Error bars indicate SD (n = 6). ∗ p < 0.05 and ∗∗ p < 0.0001, as determined by comparing selected pairs (each test was repeated three times).

