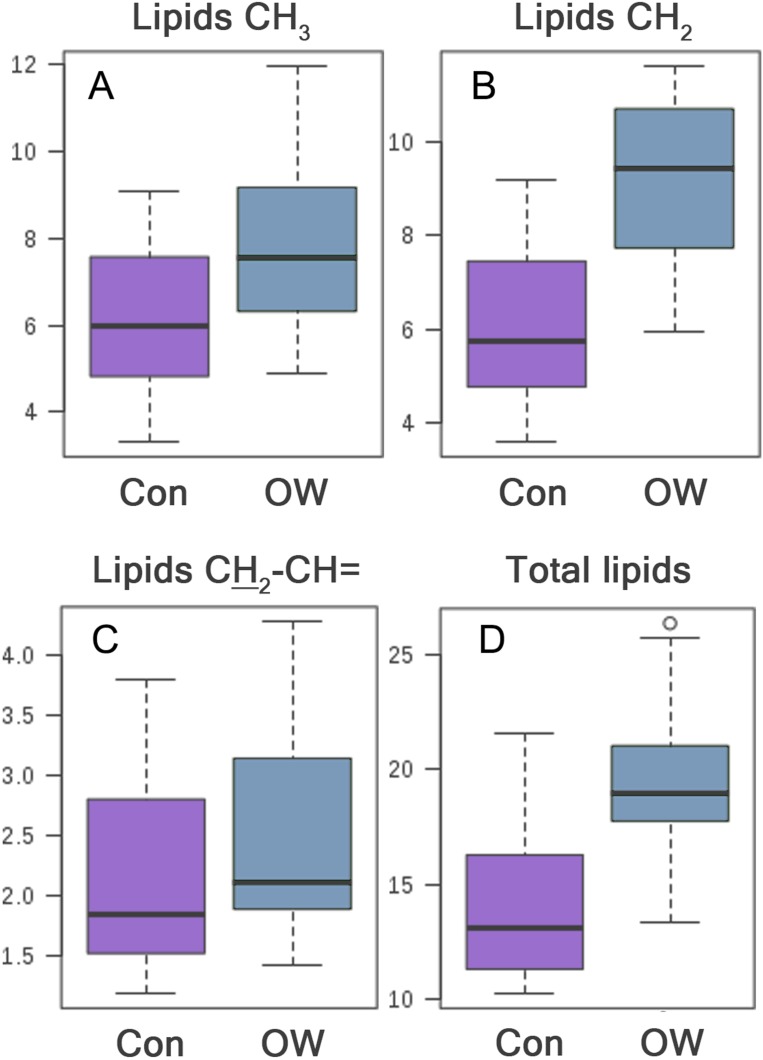
Figure 2. Box plot of metabolite intensity of lipids CH3, CH2, CH2CH= and total lipids between control group (Con) and overweight group (OW).
The lipid intensity of serum lipids obtained from OW is significantly higher than control group, (A) with CH3 lipids (p = 0.016), (B) CH2 lipids (p < 0.0001), (C) CH2–CH= lipids (p = 0.049), (D) and total lipids (p < 0.0001).

