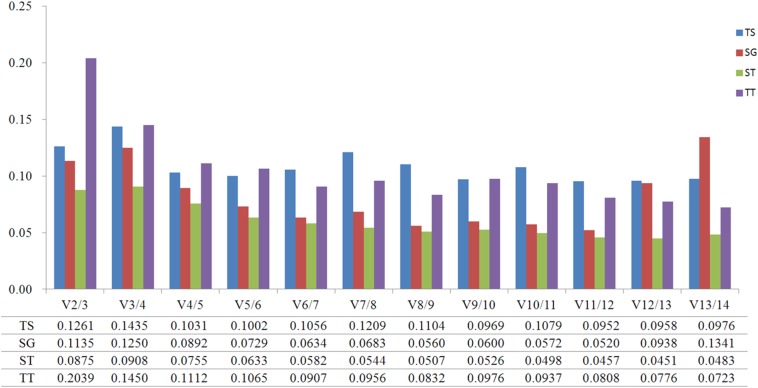
Figure 3. Pairwise variation (V) calculated using GeNorm to determine the optimal number of reference genes.
(TS) different tissues, (SG) developmental stage seedlings, (ST) stress-treated seedlings, and (TT) data from all experimental groups combined. The average pairwise variations Vn/Vn+1 were analyzed between the normalization factors NFn and NFn+1 to indicate the optimal number of reference genes in different samples.

