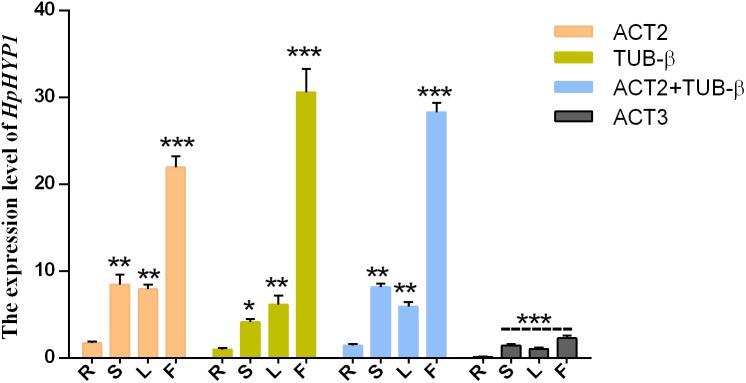
Figure 4. Relative expression levels of HpHYP1 in (R) root, (S) stem, (L) leaf, and (F) flower used for normalization using the most stable reference genes or a combination and the least stable genes.
Error bars indicate the mean standard error calculated from three biological replicates. The statistical level was according to ∗P < 0.05, ∗∗P < 0.01, and ∗∗∗P < 0.001.

