
Fig. 2. The most constrained CCRs are enriched for pathogenic variants and are restricted to a small subset of genes.
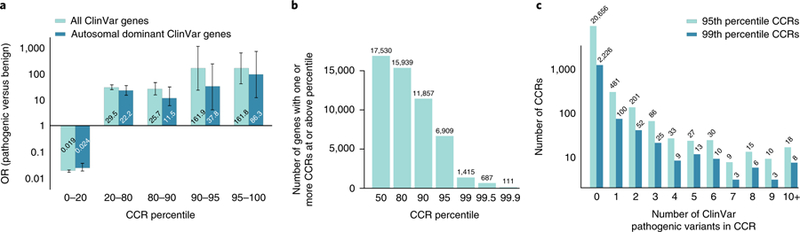
a, OR enrichment for ClinVar pathogenic variants versus benign variants for different CCR percentile bins among all autosomal ClinVar genes (light cyan) and genes that underlie autosomal dominant diseases (dark cyan). For all ClinVar genes, the error bars represent 95% CIs of 0.015–0.023 for the 0–20 percentile bin, 23.9–36.6 for the 20–80 percentile bin, 14.6–45.4 for the 80–90 percentile bin, 22.8–1,151.0 for the 90–95 percentile bin, and 40.4–647.5 for the 95–100 percentile bin. For autosomal dominant ClinVar genes, the 95% CIs are 0.017–0.035 for the 0–20 percentile bin, 14.3–34.3 for the 20–80 percentile bin, 5.12–25.7 for the 80–90 percentile bin, 5.32–269.5 for the 90–95 percentile bin, and 12.1–613.9 for the 95–100 percentile bin. A total of 24,554 pathogenic variants and 4,689 benign variants from ClinVar were intersected with CCRs; 10,781 pathogenic and 865 benign ClinVar variants lie within autosomal dominant genes. b, Histogram of the number of autosomal genes with at least one CCR greater than or equal to different percentile thresholds. c, Histogram of the number of 95th and 99th percentile CCRs with 0 to 10 or more overlapping ClinVar pathogenic variants. Highly constrained CCRs that harbor no known pathogenic variants may reflect regions under extreme purifying selection. Of the 24,554 ClinVar pathogenic variants, 2,172 (8.8%) and 551 (2.7%) were found in CCRs at or above the 95th and 99th percentile, respectively.