
Fig. 4. A comparison of CCRs with other models of genic and regional constraint.
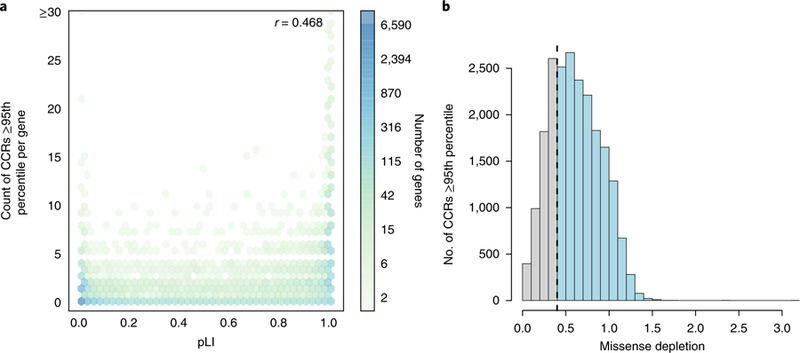
a, The correlation (Pearson r) between a gene’s pLI and the number of CCRs in the 95th percentile or higher observed in the gene. In general, genes with high pLI (>0.9) tend to harbor many such CCRs, while genes with low pLI (<0.1) do not. However, many low-pLI genes exhibit focal constraint at or above the 95th percentile. b, The relationship between CCRs in the 95th percentile or higher and the missense depletion score for the same coding region. The dashed line reflects the missense depletion threshold (ɣ > 0.4) below which Samocha et al.41 define regional constraint. Light blue bars beyond this threshold reflect CCRs at or above the 95th percentile that would not be deemed as constrained by the missense depletion metric. Gray bars reflect CCRs that coincide with regions deemed to be under constraint by missense depletion. There are 8,065,333 unique CCRs, with 21,650 at or above the 95th percentile.